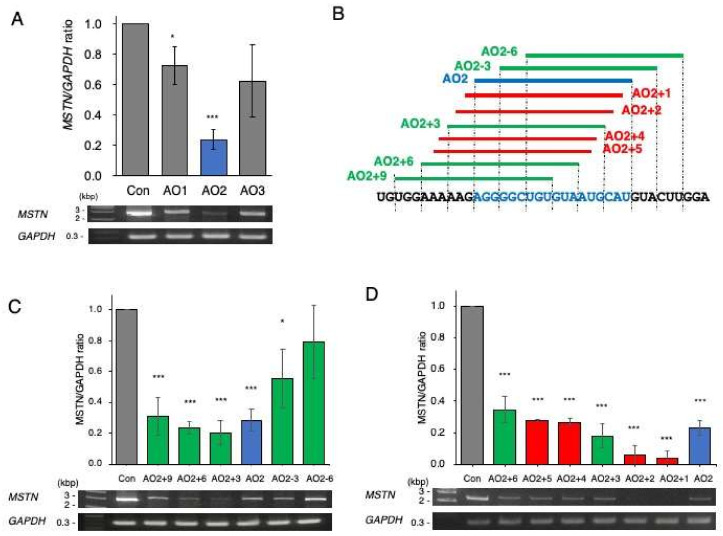
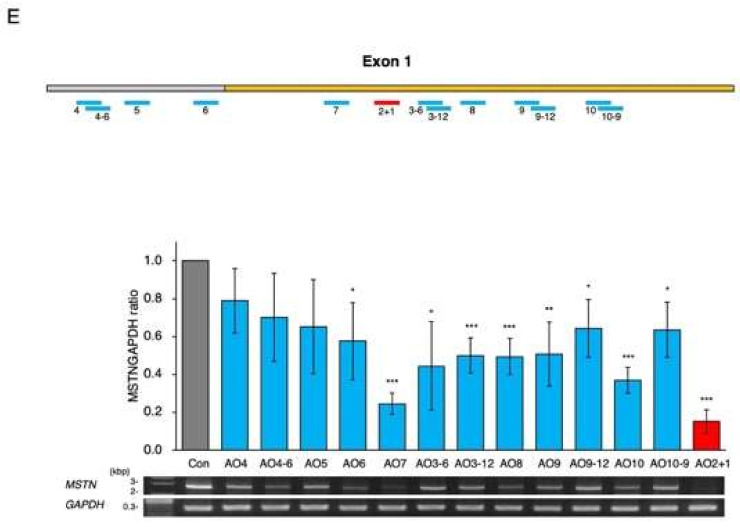
Figure 2.
Screening of ASOs that decrease MSTN mRNA levels. (A) As the first step of screening, three 18-mer ASOs (AO1–3) complementary to the splicing enhancer sequence of exon 1 were synthesized and added to the culture medium of CRL-2061 cells. Mature MSTN mRNA was RT–PCR amplified, and the MSTN/GAPDH ratio was calculated. Electrophoretograms of the RT–PCR-amplified products are shown (bottom), and the MSTN/GAPDH ratios are shown as bars (top). All three ASOs decreased the ratio, and AO2 decreased the ratio to approximately 0.2. (B). Illustration of the locations of the designed ASOs. To find the ASO that most effectively decreased the MSTN/GAPDH ratio, another nine ASOs (five (green bar) and four (red bar) ASOs in the second and third screenings, respectively) were synthesized around AO2 (blue bar). The nucleotide sequences are described below, and the sequence complementary to AO2 is colored blue. (C). In the second screening, five ASOs (AO2+3, AO2+6, AO2+9, AO2–3, and AO2–6) were synthesized and examined for their ability to decrease mature mRNA levels. Among the five, AO2+3 showed the strongest ability to decrease the ratio. (D). In the third screening, another four ASOs (AO2+1, AO2+2, AO2+4, and AO2+5) were synthesized and examined for their suppression ability. Remarkably, AO2+1 decreased the ratio most strongly. Therefore, AO2+1 was selected as the optimal ASO for reducing MSTN mRNA levels. (E). As the final step, 12 ASOs scattered over exon 1 were synthesized, and their suppression activity was examined. The locations of the ASOs are schematically described (bars) below the exon sequences (the gray and yellow boxes indicate the noncoding and coding regions of exon 1, respectively). The amount of product was calculated and is expressed as the ratio of MSTN to GAPDH. No ASO showed higher activity than AO2+1. AO2+1 was therefore selected as the best ASO. * = p < 0.05, ** = p < 0.01, *** = p < 0.001 vs. control.


