Figure 5.
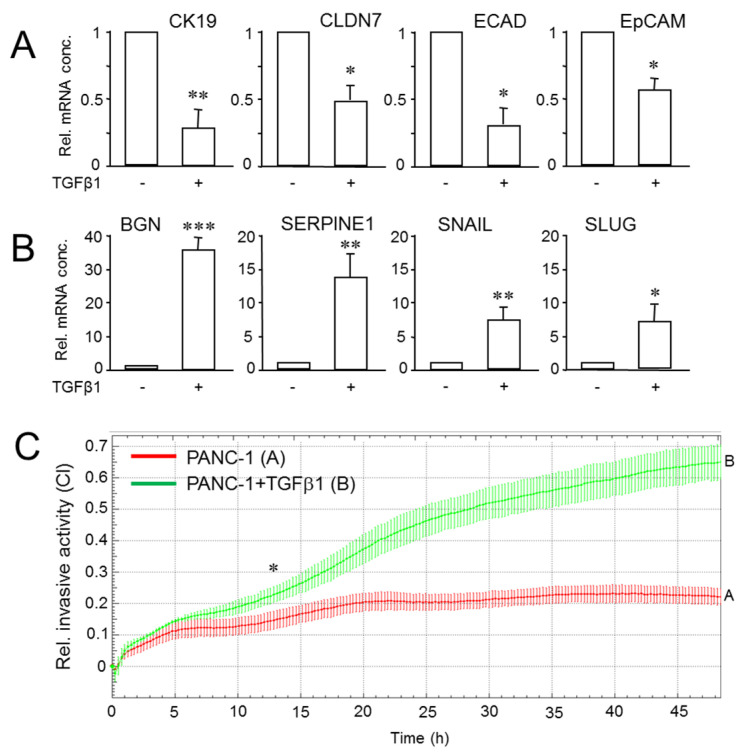
PANC-1 cells can be shifted towards a more mesenchymal and invasive phenotype by activation of a TGFβ transcriptional program. (A) Parental PANC-1 cultures were treated with TGFβ1 for 24 h followed by qPCR analysis of CK19, CLDN7, ECAD and EpCAM. The data shown (means ± SD of three replicates) are representative of three experiments. Significant differences (p < 0.05) are marked by asterisks (*). (B) As in (A), except that primers for BGN, PAI-1, SNAIL1 and SLUG were used. Ct values were normalized with those for GAPDH in the same samples. (C) PANC-1 cells were subjected to real-time cell invasion assay on an xCELLigence platform in the presence or absence of TGFβ1 (5 ng/mL). Data are representative of three assays and are the means ± SD of triplicate wells. The asterisk marks the earliest time point with significant differences between TGFβ1-treated and untreated control cells. ** p < 0.01, *** p < 0.001.

