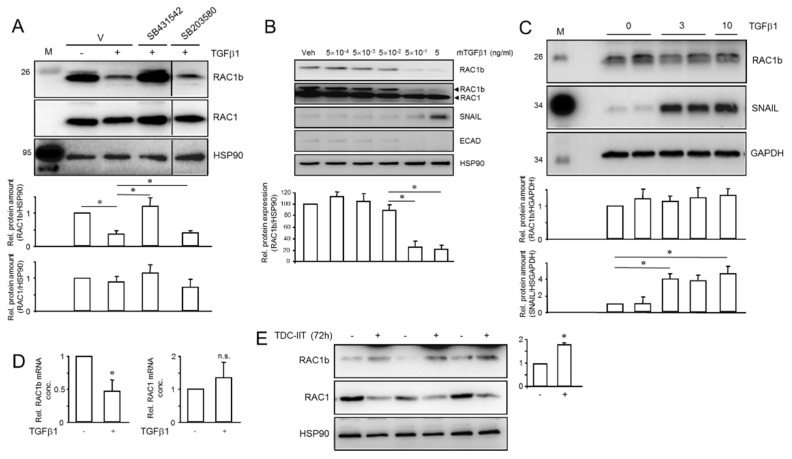
Figure 7.
Treatment with TGFβ1 downregulates endogenous but not ectopically expressed RAC1b in PANC-1 cells. (A) PANC-1 cells were treated or not for 3 d with 5 ng/mL of TGFβ1 in the absence or presence of vehicle (DMSO) or the indicated small molecule inhibitors, followed by lysis and sequential immunoblotting of RAC1b, RAC1 and HSP90 as a loading control. Data quantification by densitometric analysis of band intensities plotted relative to untreated control cells represents the mean ± SD of three experiments. Asterisks (*) indicate a significant difference. The horizontal lines between lanes 4 and 5 of the blots denote removal of irrelevant lanes. (B) PANC-1 cells were treated, or not, for 120 h with the indicated concentrations of rec. human (rh) TGFβ1 followed by sequential immunoblotting of RAC1b, RAC1, SNAIL and ECAD. The graph below the blot provides quantitative data for RAC1b derived from densitometric readings of RAC1b and HSP90 (mean ± SD, n = 3). (C) PANC1-1 cells ectopically expressing HA-tagged RAC1b were left untreated or were treated for 3 d or 10 d with TGFβ1 followed by immunoblot analysis of RAC1b, SNAIL and GAPDH as loading control. Please note unaltered expression of ectopic RAC1b and induction of SNAIL as a control for TGFβ1 biological activity. Data are the means ± SD of three replicates and are representative of three experiments performed in total. (D) Effect of a 24 h treatment with TGFβ1 on RAC1b (left-hand graph) or RAC1 (right-hand graph) steady-state mRNA levels as measured by qPCR (mean ± SD of three experiments). The asterisk indicates a significant difference; n.s., not significant. (E) PANC-1 cells were subjected to TDC-IIT for 72 h followed by immunoblot analysis of RAC1 and RAC1b. The assay shown (means ± SD of three replicates each) is representative of three experiments. The graph to the right shows RAC1b signal quantification based on densitometric readings from three assays (n = 3). The asterisk (*) denotes a significant difference (p < 0.05).

