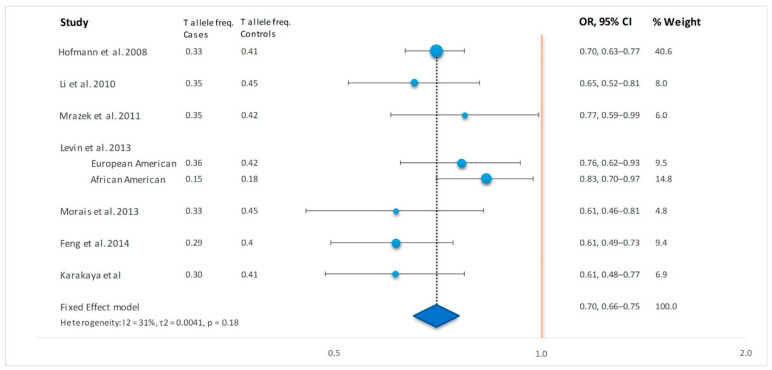
Figure 1.
Meta-analysis for the studies of ANXA11 with sarcoidosis. Forest plot of the odds ratio for ANXA11 rs1049550 T allele in sarcoidosis cases versus controls. For correct presentation, the C and T allele are switched for the studies of Levin et al. Dotted line represents the odds ratio from the combined analysis. The result of the meta-analysis is presented as a diamond at the bottom that covers the combined OR in the middle and the CI at the tips. OR: Odds ratio, 95% CI: 95% confidence interval.

