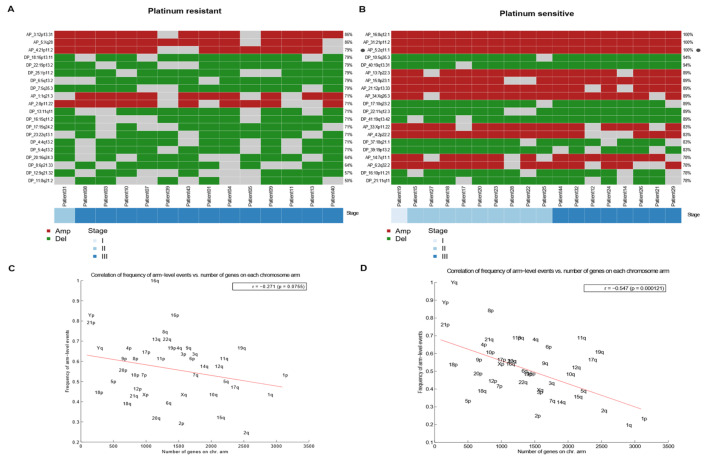
Figure 5.
Most frequent arm-level amplifications/deletions events between sensitive and resistant TGCT. (A,B) Heatmap of arm-level regions top 20 in platinum resistant samples, each row represents a segment with its frequency, and each column a patient of the cohort that presents an event in these regions. Ordered by stage. Left to the right, resistant and sensitive. (C,D) Correlation (with significant p value) between frequency of arm level events (Y) and number of genes in chromosome arm (X) in platinum-resistant and platinum-sensitive, respectively. Anticorrelation (-r) is higher in sensitive samples, left to the right, resistant and sensitive.

