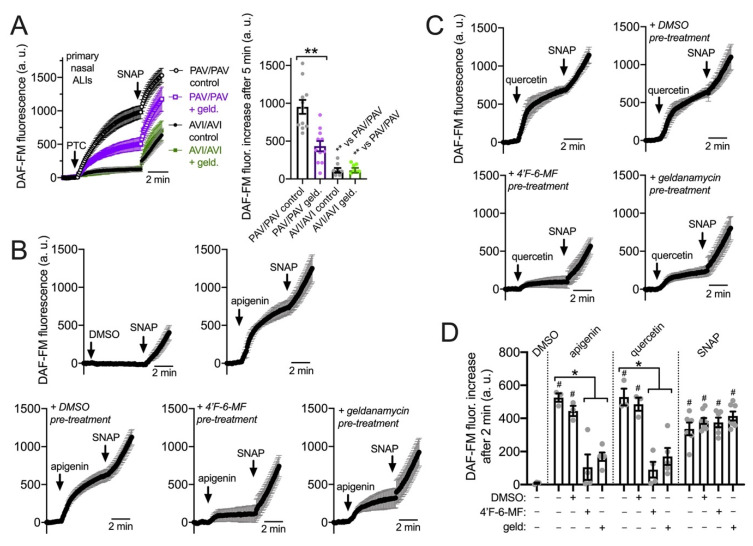
Figure 4.
HSP90 inhibition reduces T2R-stimulated intracellular NO production in primary sinonasal epithelial cells grown at the air–liquid interface (ALI). (A): Intracellular DAF-FM increases were measured in response to T2R38-agonist PTC (1 mM) followed by NO donor SNAP (25 µM) as positive control. PTC stimulated NO production in ALIs from PAV/PAV (homozygous functional T2R38) but not AVI/AVI (homozygous non-functional T2R38) ALIs (nonfunctional T2R38) patients. Geldanamycin pretreatment inhibited the NO production in PAV/PAV ALIs. Trace and bar graph show the mean ± SEM of 8–10 experiments per condition using ALIs from 4–5 patients. Significance determined by one-way ANOVA with Tukey–Kramer post-test comparing all values; ** p < 0.01. (B): Traces of DAF-FM fluorescence in PAV/AVI (heterozygous T2R38) cultures stimulated with T2R14/39 agonist apigenin (100 µM) shown with 0.1% DMSO vehicle control. Pretreatment with T2R14/39 antagonist 4′-fluoro-6-methoxyflavanone (4′-F-6-MF) or HSP90 inhibitor geldanamycin but not 0.1% DMSO (inhibitor vehicle control) reduced apigenin-induced but not SNAP-induced DAF-FM fluorescence increases. (C): Traces of DAF-FM fluorescence in PAV/AVI (heterozygous T2R38) cultures stimulated with T2R14 agonist quercetin (50 µM). Pretreatment with T2R14/39 antagonist 4′-fluoro-6-methoxyflavanone (4′-F-6-MF) or HSP90 inhibitor geldanamycin but not 0.1% DMSO (inhibitor vehicle control) reduced quercetin-induced but not SNAP-induced DAF-FM fluorescence increases. (D): Bar graph of intracellular DAF-FM fluorescence increases after 2 min stimulation from experiments as in (C,D). Stimulation (DMSO vehicle control, apigenin, quercetin, or SNAP) listed on top and pretreatment (DMSO vehicle control, 4′-F-6-MF, or geldanamycin) listed on the bottom. Each data point is an independent experiment (n = 4–8 per condition). Significance by Bonferroni post-test; * p < 0.05 vs. bracketed bars; # p < 0.05 vs. DMSO alone.

