Figure 7.
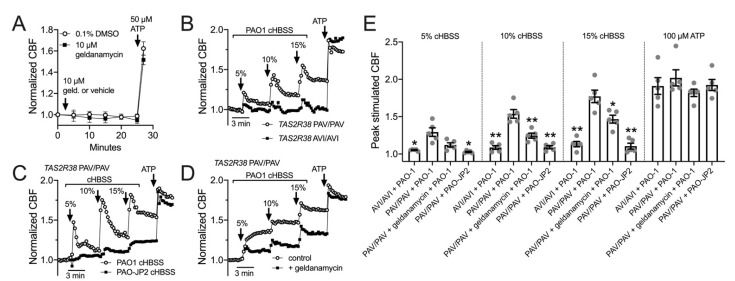
HSP90 inhibition reduces epithelial ciliary response to P. aeruginosa conditioned medium. (A): Graph shows real-time measurement of CBF (mean ± SEM of six independent experiments using ALIs from three patients) during prolonged geldanamycin treatment, followed by stimulation with purinergic agonist ATP. (B): Primary nasal ALIs genotyped for functional T2R38 (TAS2R38 PAV/PAV) or non-functional T2R38 (TAS2R38 AVI/AVI) were stimulated with diluted HBSS in which P. aeruginosa PAO-1 had been incubated overnight (conditioned HBSS; cHBSS, diluted with unconditioned HBSS). Peak CBF responses to PAO-1 cHBSS were greater in PAV/PAV cells vs. AVI/AVI cells. Representative trace shown from five experiments using cultures from separate individual patients. (C): PAV/PAV cells were stimulated with cHBSS from PAO-1 or PAO-JP2, which lacks the ability to produce AHLs. PAO-1 cHBSS stimulated CBF increases that were greater than CBF increases observed with PAO-JP2 cHBSS. Representative trace shown from five experiments using cultures from separate individual patients. (D): PAV/PAV cells were stimulated with PAO-1 cHBSS ± geldanamycin pretreatment. Representative trace shown from five experiments using cultures from separate individual patients. (E): Bar graph showing peak CBF (mean ± SEM with individual data points showing individual experiments) observed from experiments as in F-H. Asterisks represent significance compared with PAV/PAV + PAO-1 cHBSS at each individual concentration, determined by Sidak’s multiple comparison test; * p < 0.05 and ** p < 0.01.

