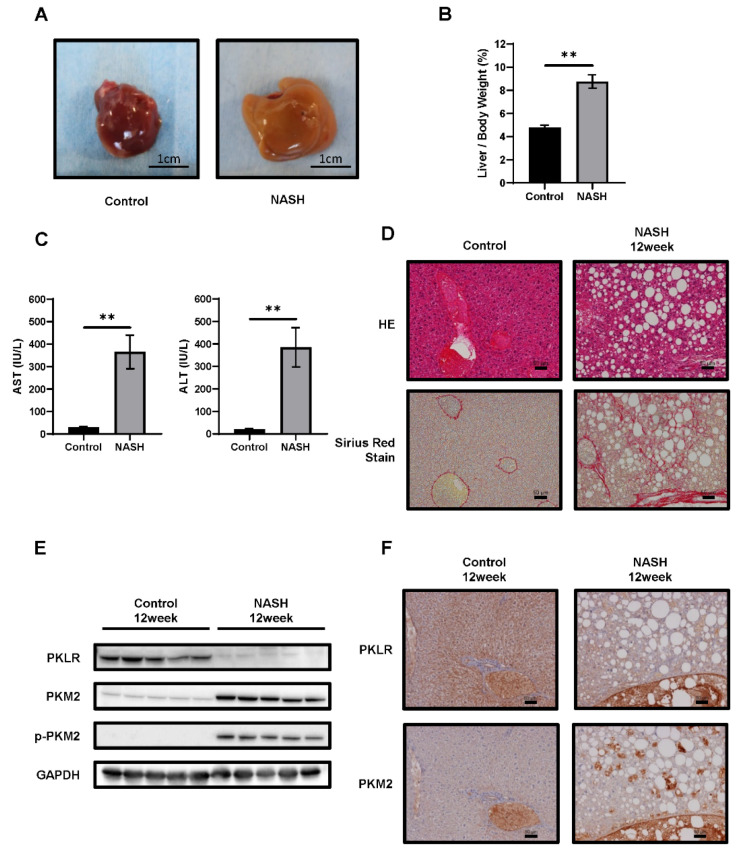
Figure 3.
Comparison between C57BL/6J mice fed the standard diet (SD) or choline-deficient, L-amino-acid-defined, high-fat diet (CDAHFD) for 12 weeks. (A) Representative macroscopic appearance of control (n = 5) and non-alcoholic steatohepatitis (NASH) (n = 5) livers. Scale bars = 1 cm. (B) The liver-to-body weight ratio in each group. (C) AST and ALT levels in plasma. Values represent the mean ± SD. Note: ** p ˂ 0.01 vs. control. (D) HE-stained and Sirius Red-stained liver sections. Scale bars = 50 µm. (E) Western blotting analysis and (F) immunohistochemistry (IHC) of the expression levels of PKM2, phosphorylated PKM2 (p-PKM2), and PKLR. GAPDH was used as an internal control. Scale bars = 50 µm.

