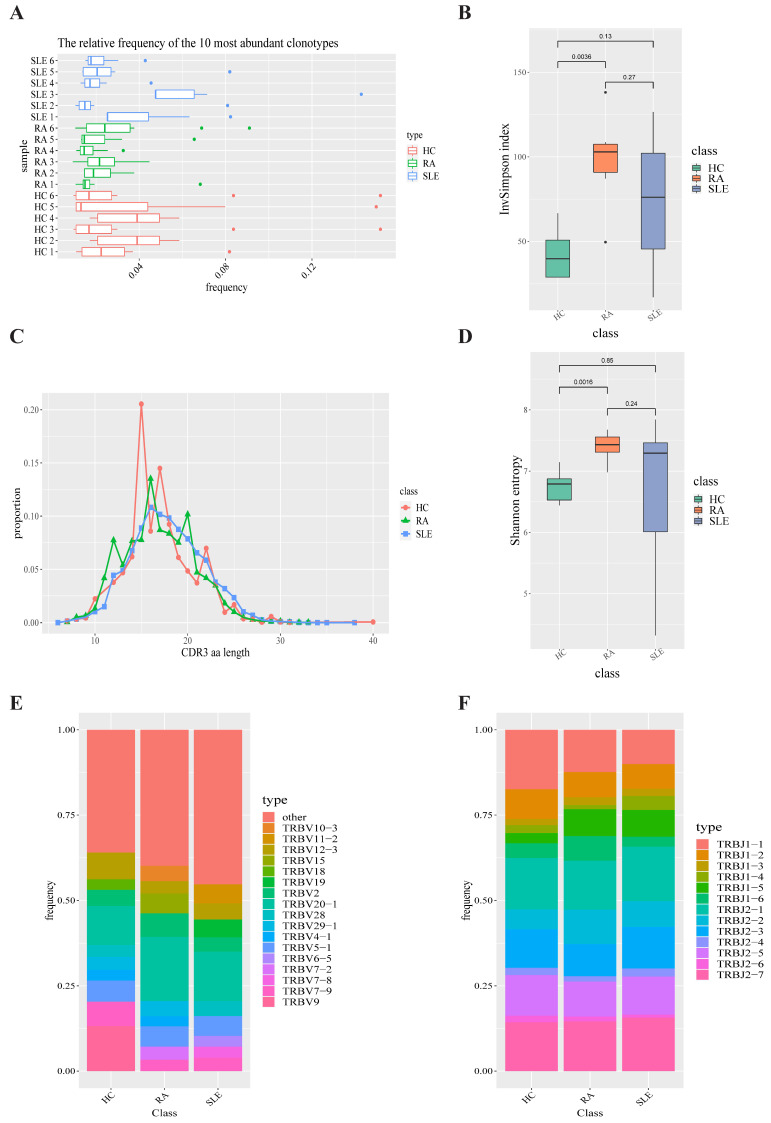
Figure 2.
T-cell receptor repertoire construction and analysis. (A) Box plot showing the top 10 high-frequency T-cell clonotypes for each sample under SLE, RA and HC conditions in this study. (B) Box plots of Shannon–Weiner index for each sample under SLE, RA and HC conditions are used to compare the TCR diversity between SLE, RA and HC groups. (C) Distributions of TCR CDR3 amino acid sequence length in SLE, RA and HC groups. (D) Box plots of InvSimpson index for each sample under SLE, RA and HC conditions are used to compare the TCR diversity between SLE, RA and HC groups. (E) TRBV gene-usage-frequency stacked histogram showing the distributions of common TRBV gene in the SLE, RA and HC groups, respectively. (F) TRBJ gene-usage-frequency stacked histogram showing the distributions of common TRBJ genes in the SLE, RA and HC groups, respectively.

