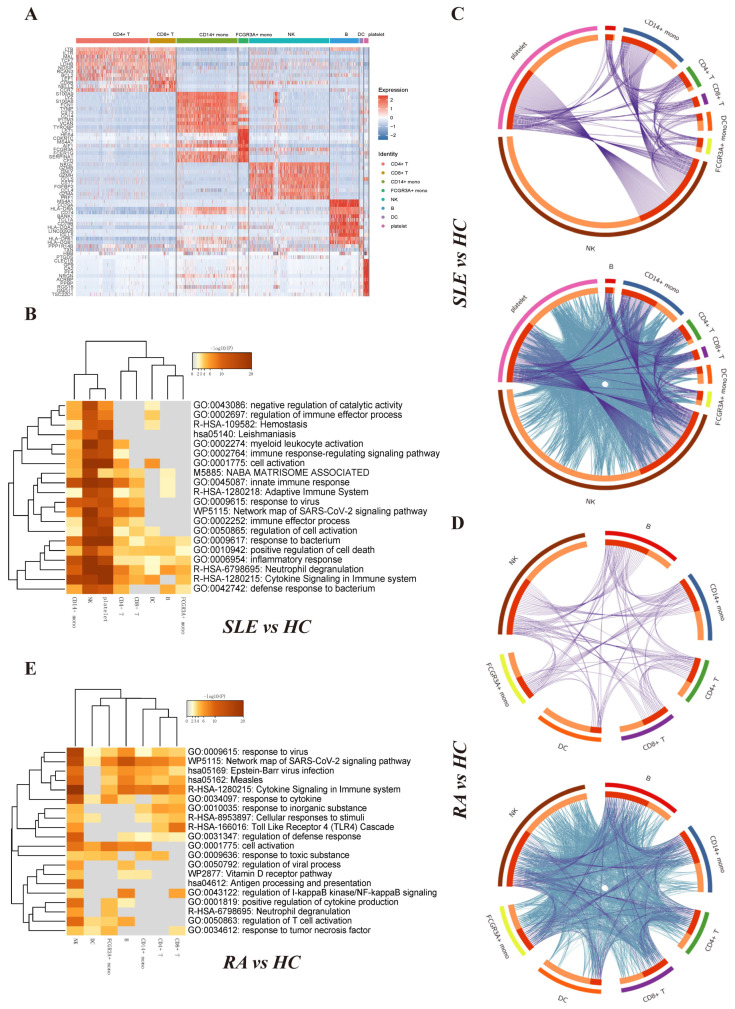
Figure 5.
Differentially expressed gene identification and functional and pathway enrichment analysis of distinct immune cells. (A) Heat map of the top featured marker genes for distinct immune cell types. (FDR < 0.05, logFC > 1) (B) Heat map of the enriched functional and signaling pathways of differentially expressed genes between SLE group and HC group in distinct immune cell types. The heat map cells are colored according to the p-value of the enriched terms, and white cells indicate a lack of enrichment for that term. (C) The Circos plot shows how differentially expressed genes between SLE group and HC group from the given immune cell types overlap. Each arc represents each gene list’s identity. Purple lines link the same gene that is shared by multiple gene lists. Blue lines link the different genes where they fall into the same ontological term (the term needs to be statistically significantly enriched with a size no larger than 100). (D) The Circos plot shows how differentially expressed genes between RA group and HC group from the given immune cell types overlap. (E) Heat map of the enriched functional and signaling pathways of differentially expressed genes between RA group and HC group in distinct immune cell types.

