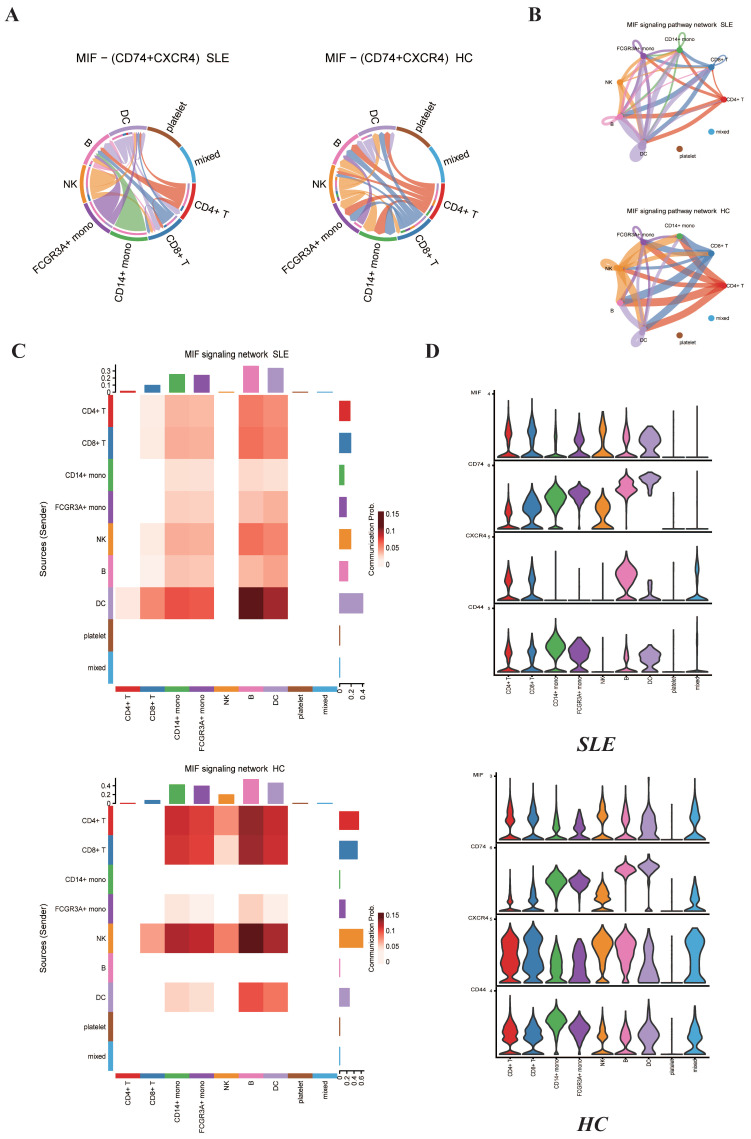
Figure 6.
Cell-to-cell communications of MIF family signaling pathways among the distinct immune cells in the PBMC between SLE group and HC group predicted by the CellChat software. (A) Chord plots showing the interactions of ligand/receptor pairs MIF–(CD74 + CXCR4) between SLE group and HC group. (B) Circle plots summarizing the interactions of MIF signaling pathways among individual cell types in both SLE and HC groups. (C) Heat map showing the relative contribution of each cell type based on the computed four-network centrality measures of MIF signaling network between SLE and HC groups. (D) Violin plots showing the expression levels of MIF family cytokines in each immune cell type for both SLE and HC groups.

