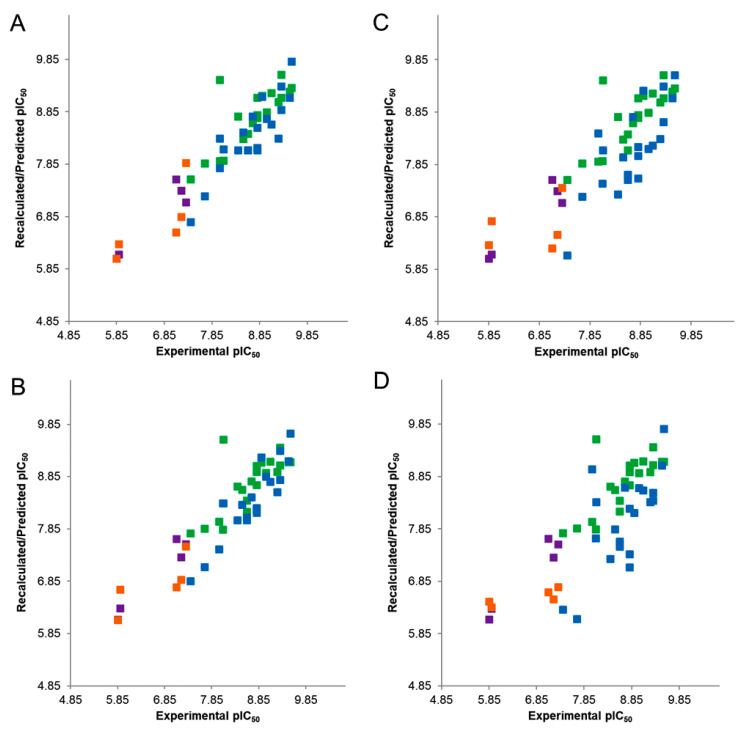
Figure 4.
Experimental vs. recalculated (“actives”: green squares; “inactives”: purple squares) and predicted (“actives”: blue squares; “inactives”: orange squares) pIC50s for ADDHHHP.13 hypothesis and LOO cross-validation (A); ADDRRRP.11 hypothesis and LOO cross-validation (B); ADDHHHP.13 hypothesis and LSO cross-validation (C); ADDRRRP.11 hypothesis and LSO cross-validation (D).

