Figure 2.
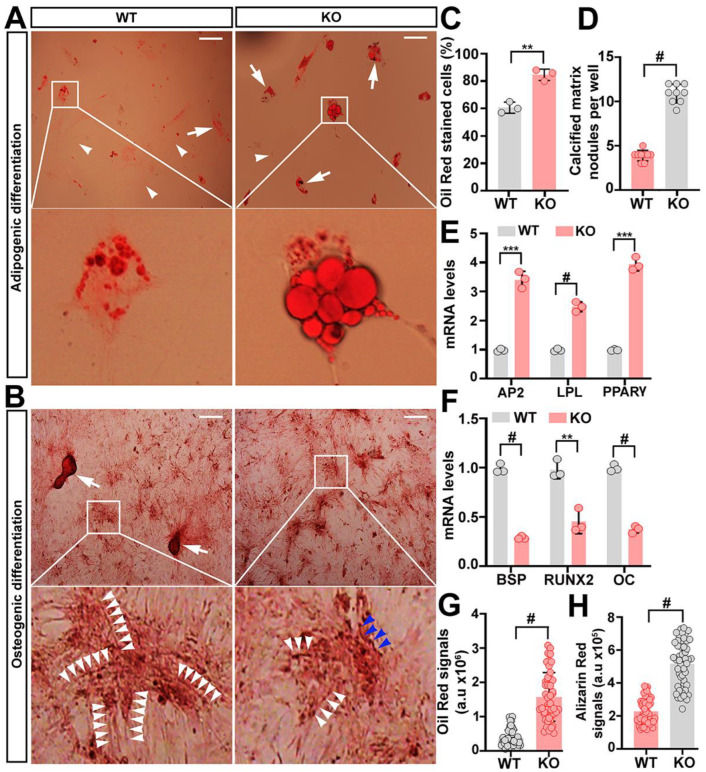
(A–H) Comparison of the lineage differentiation between WT and trappc9-deficient ASCs. After induced differentiation to the adipogenic (A) or osteogenic (B) lineage for 14 days, cells were stained with Oil red O (A) or Alizarin red (B) and imaged. Shown are examples of images of cells stained with Oil red O (A) or Alizarin red (B). Boxed regions were enlarged and shown beneath the corresponding image. Enlarged boxed regions in (A) highlighted clusters of aberrantly large lipid droplets in an adipogenic cell derived from trappc9-null (KO) ASCs. In images in (A), arrowheads point to cells that were stained with oil red, whereas arrows identified cells stained with oil red. Arrowheads in images of the enlarged boxed regions in (B) indicated the string pattern of mineral deposition in osteoblasts derived from WT ASCs; such string-like structures were twisted (blue arrowheads) in osteoblasts from trappc9-null (KO) ASCs. Scale bars: 100 μm. Quantitative analysis of cells stained with Oil red or with Alizarin red (C) as well as qPCR analysis of transcripts for adipogenic (D) and osteogenic (E) genes revealed that trappc9-deficient (KO) ASCs preferred adipogenic differentiation. In (C), average percentage of cells stained with oil red was graphed, whereas average calcified matrix nodules per well was counted and used as a measure of osteogenic differentiation. (F) Densitometry quantification of signals for oil red (A) or Alizarin red (B) showed that upon induction, cells derived from trappc9-null (KO) ASCs enriched more lipids and deposited minerals to a lesser degree than cells derived from WT ASCs. All experiments were repeated three times. Data are Mean ± SD. Unpaired two-tailed Student’s t-test: ** p < 0.01, *** p < 0.001, # p < 0.0001.

