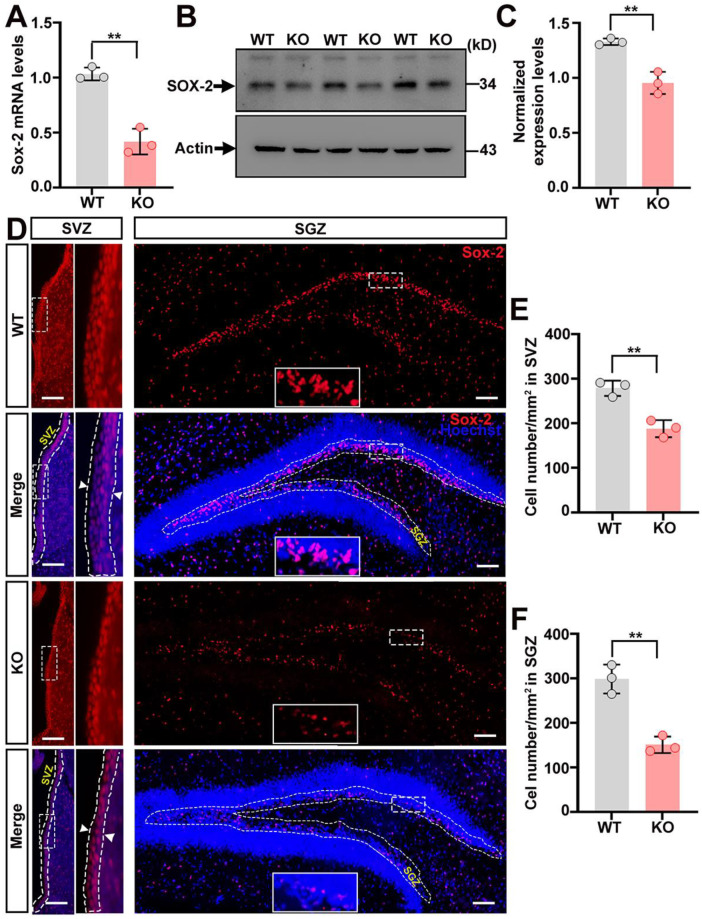
Figure 6.
The content of neural stem cells declines in the brain of trappc9-deficient mice. Quantitative PCR (A) as well as Western blot (B) followed densitometry (C) analyses showed lower expression levels of Sox-2 in the brain of 3-week-old trappc9-null (KO) mice as compared to age-matched WT mice. Actin was a reference or loading control. Expression levels of Sox-2 in the brain were normalized with signal intensities of actin. (D) A series of 3 coronal brain sections of 3-week-old WT and trappc9-null (KO) mice were processed for immuno-labeling Sox-2 (red) and staining with Hoechst 34580 (blue) to identify all cells in brain sections. Images for red and blue channels were captured separately through a 20× objective with the Olympus BX53 imaging system. Merged images of different areas were re-aligned into one image of that brain section. Dashed contours indicated the subventricular zone (SVZ) and subgranular zone (SGZ). Boxed regions were enlarged and shown to the right (SVZ) or in the lower-middle region (SGZ) of the corresponding image. Arrowheads in the enlarged boxed regions indicated the thickness of the SVZ zone. Scale bar: 100 μm. (E,F) Cell counting of Sox-2-positive cells within dashed SVZ and SGZ contours showed a decreased number of cells in trappc9-null (KO) mice as compared to WT mice. Data are Mean ± SD. Two tailed Student’s t-test: ** p < 0.01.

