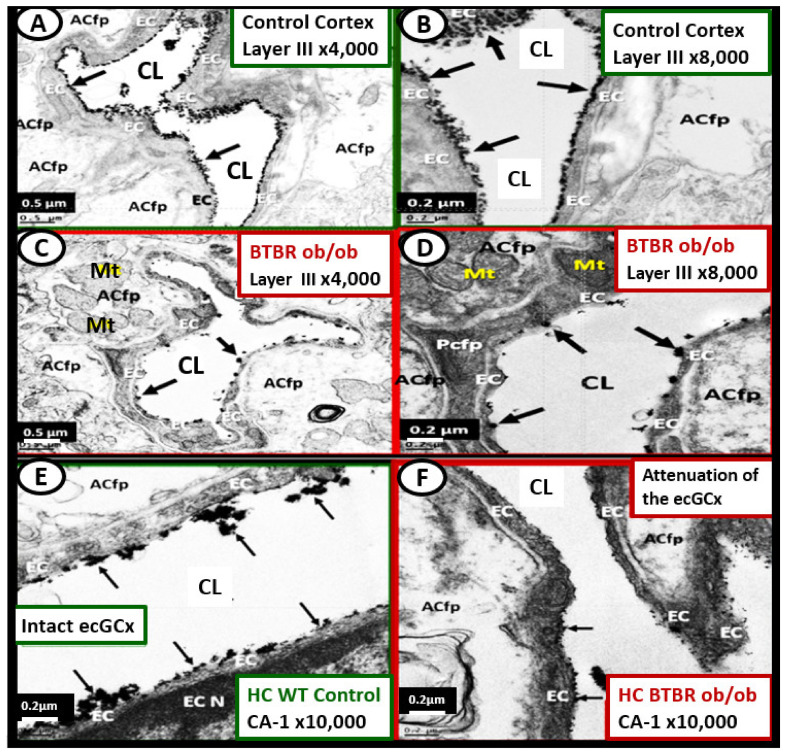
Figure 17.
Lanthanum nitrate (LAN) staining of the neurovascular unit (NVU) endothelial glycocalyx (ecGCx) brain endothelial cells (BECs) in the female, obese, insulin resistant, diabetic BTBR ob/ob preclinical mouse models at 20-weeks of age reveal an attenuation and/or loss of the ecGCx as compared to control models. Panels A and B demonstrate the marked electron-dense staining of the ecGCx (arrows) on the luminal surface of BECs with LAN perfusion fixation. Panels C and D depict a marked attenuation of the ecGCx and even in some area it appears to be completely lost. Note that the ecGCx appears to clump and that it is discontinuous as compared to the continuous coverage in control models (panels A and B). Panel E demonstrates the decoration of the BECs by the ecGCx in the hippocampal CA-1 regions in control models. Panel F depicts an almost complete loss of the ecGCx on the surface layer of BECs as compared to the control (panel E). Here it is important to note that there were no mitochondria abnormalities observed in the BTBR ob/ob models as compared to images that were present in the db/db models previously discussed. Overall, we found the ultrastructural remodeling changes to be less in the BTBR ob/ob models as compared to the db/db in regard to NVU pericytes, ACs, and BBB tight junction abnormalities including less brain atrophy as compared to the db/db models. This may suggest that ecGCx may be an early remodeling change in the diabetic BTBR ob/ob. Images modified and provided by CC 4.0 [52]. Magnification ×4000; scale bar = 0.5 μm (panels A and B); Magnification x8000; scale bar = 0.2 μm (panels B and D); Magnification ×10,000; scale bar = 0.2 μm (panels E and F). ACfp = astrocyte foot processes; CA-1 = Cornu Ammonis-1; CL = capillary lumen; HC = hippocampus; Mt = mitochondria; Pcfp = pericyte foot processes.

