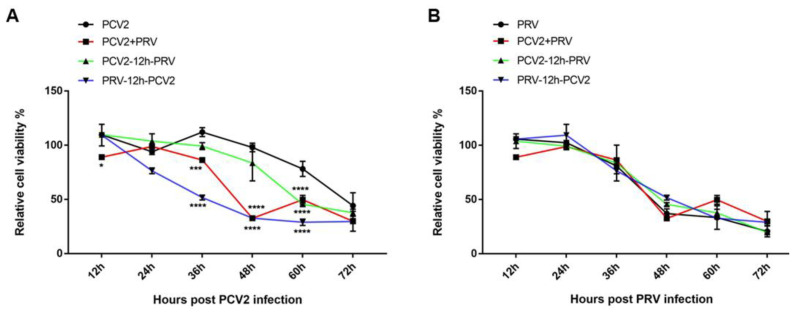
Figure 2.
Cell viability of PCV2 (A) and PRV (B) in different infection groups. PK-15 cells were infected with different combinations of PCV2 and/or PRV for 12, 24, 36, 48, 60, and 72 h, and then the cell viability was evaluated by CCK8 at indicated hours after the indicated virus infection. *, p-value < 0.05; ***, p-value < 0.001; ****, p-value < 0.0001.

