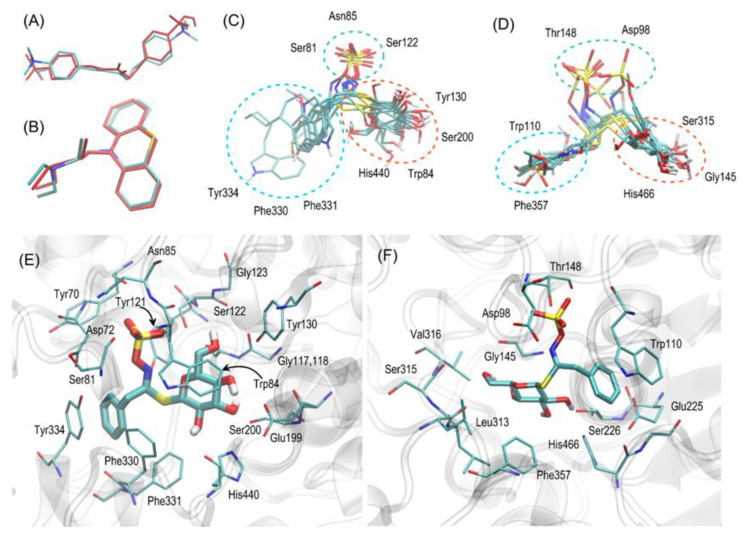
Figure 7.
(A,B) The graphical illustration of the validation results, i.e., the superposition of the most favorable ligand poses found during docking (colored in red) with the position of the co-crystalized ligand, present in the binding cavity of AChE (A) or BuChE (B) (colored by atom type). (C,D) The superposition of the most favorable poses of all ligands interacting with either AChE (C) or BuChE (D). The selected amino acids creating the most essential ligand–protein contacts are given separately for each of ligand moieties. (E,F) The most favorable location of compound glucotropaeolin molecule bound to either the AChE (E) or BuChE (F) structure. The ligand molecule is shown as thick sticks, whereas all the closest amino acid residues (of distances no larger than 0.4 nm) are represented by thin sticks. The description of the interaction types is given in the text.

