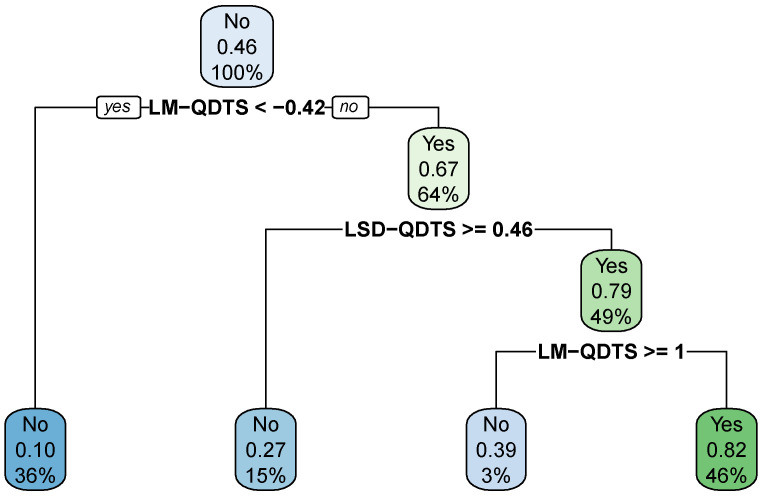
Figure 11.
Optimal Decision Tree. Final decision tree estimated on the normalized feature space via the CART algorithm, tuned to maintain the detection prevalence at the level of the prevalence of walking activities in the data and to maximize precision first and accuracy if possible. In each node of the tree, the first row indicates the hard prediction where “No” stands for non-walking activity while “Yes” stands for walking activity; the second row reports the soft prediction, i.e., the probability for a time point to be associated with a walking activity; the third row displays the proportion of data points in the training set that fall into the node.

