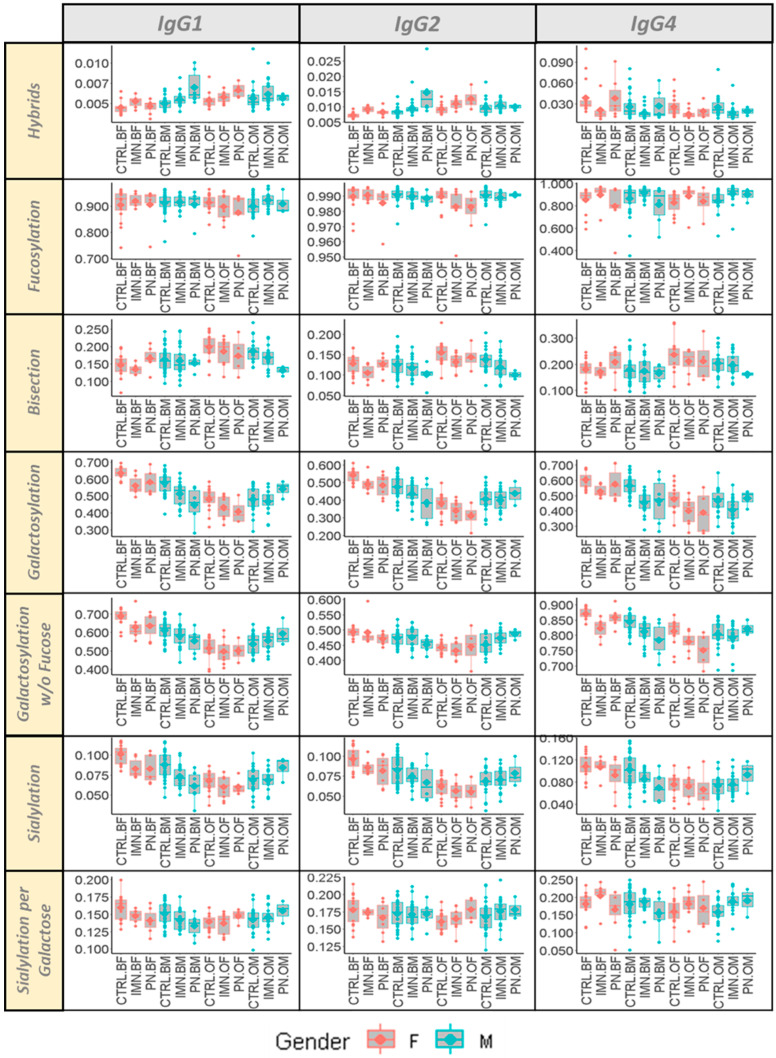
Figure 2.
Box plots of seven glycosylation traits of IgG1, IgG2, and IgG4 stratified according to sex (F = female, M = males) and age (O = over 60 years old—age ≥ 60; B = below 60 years old—age < 60) for all the groups of the cohort (IMN = Idiopathic Membranous Nephropathy; CTRL = healthy controls; PN = pathological controls with non-IMN nephropathy).

