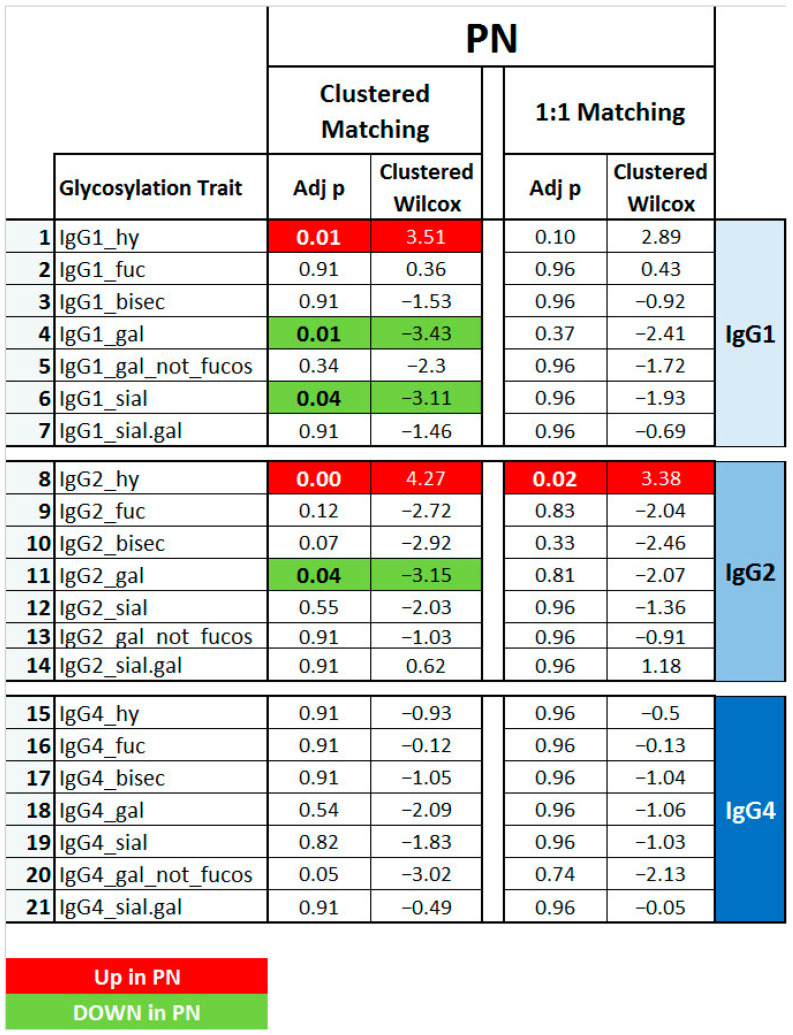
Figure 4.
Comparisons between PN patients and matched controls considering the seven glyco-patterns* for each IgG subclass (1, 2 and 4). Matching was performed using a clustered or one-to-one approach. Green and bold indicate significant (p < 0.05) lower levels in PN patients, while red and bold refers to significant (p < 0.05) higher levels PN patients (clustered Wilcox). * hy = hybrid glycoforms; fuc = with fucosylation; bisec = with bisection; gal = with galactosylation; sial = with sialylation; gal_not fucos = galactosylation of non-fucosylated glycoforms; sial.gal = sialylation per galactose.

