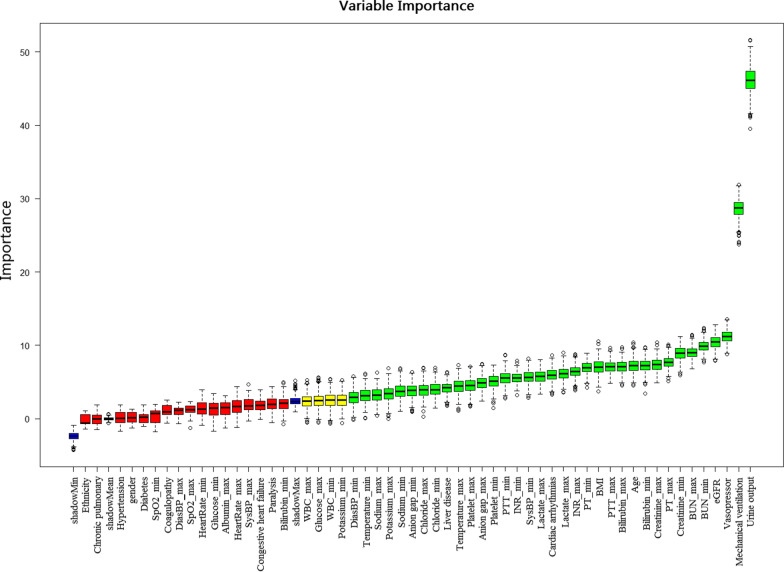
Fig. 2.
Feature selection based on the Boruta algorithm. The horizontal axis is the name of each variable, and the vertical axis is the Z-value of each variable. The box plot shows the Z-value of each variable during model calculation. The green boxes represent the first 35 important variables, the yellow represents tentative attributes, and the red represents unimportant variables. BMI: body mass Index; eGFR: estimated glomerular filtration rate; PT: prothrombin time; PTT: partial thromboplastin time; INR: International Normalized Ratio; BUN: blood urea nitrogen; SysBP: systolic blood pressure; DiasBP: diastolic blood pressure

