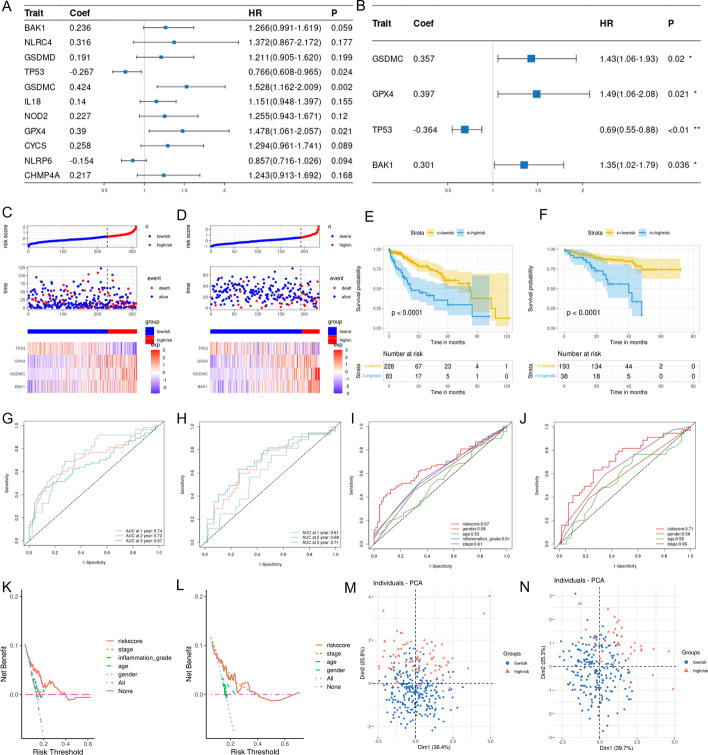
Fig. 3.
Construction and validation of the pyroptosis-related risk model. A Eleven PRGs screened by univariate Cox analysis were associated with HCC prognosis in the TCGA cohort (P < 0.20). B The multivariate Cox analysis of the 4 PRGs used to construct the risk score. C, D The proportion of deaths and the expression of the 4 PRGs changed in high-risk and low-risk groups as risk scores increased. Red, upregulated PRGs; blue, downregulated PRGs. (C: TCGA cohort; D: ICGC cohort). E, F The Kaplan–Meier curves of the OS in the high-risk and low-risk groups and P value obtained by log-rank test. Blue represents the high-risk group, and yellow, the low-risk group. (E: TCGA cohort; F: ICGC cohort). G, H The time-dependent ROC was used to display the predictive efficiency of the risk score for HCC prognosis at different times. (G: TCGA cohort, H: ICGC cohort). I, J The ROC curve was used to display the predictive efficiency of risk score and other clinical information for patient 3-year survival. (I: TCGA cohort, J: ICGC cohort). K, L The DCA was used to analyze the accuracy of the risk score for HCC prognosis. (K: TCGA cohort, L: ICGC cohort) M, N PCA for the 4 PRGs revealed the high-risk group and the low-risk group could be distributed in different regions. Blue, low-risk group; Red, high-risk group. (M: TCGA cohort, N: ICGC cohort)

