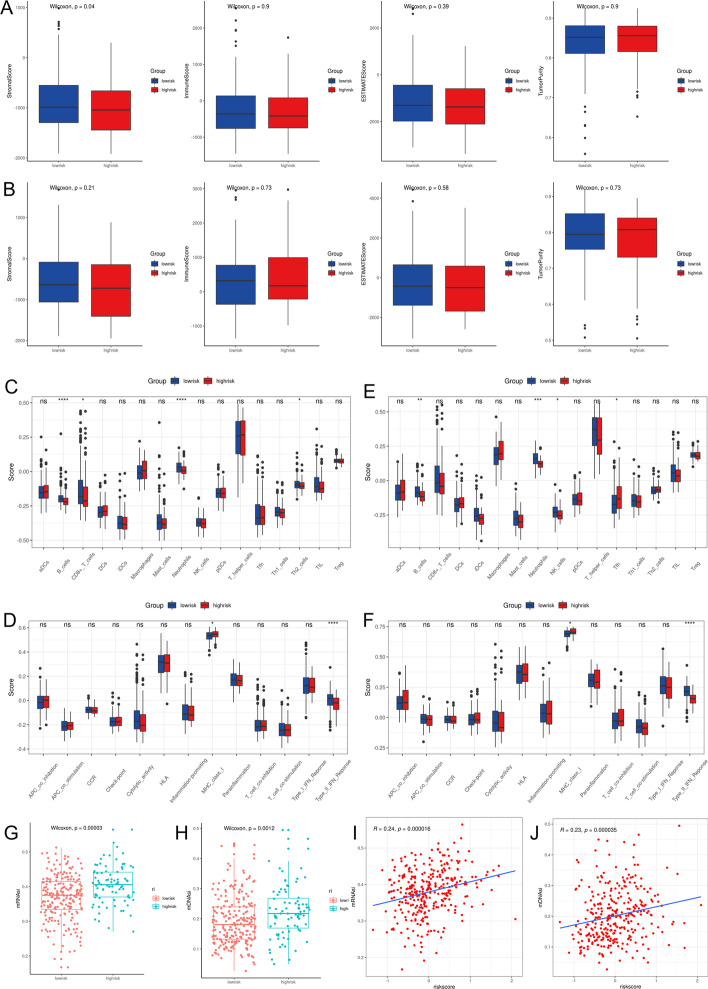
Fig. 7.
Comparison of immune status between the high-risk and low-risk groups. A, B Comparison of the stromal scores, immune scores, ESTIMATE scores, and tumor purity. (A TCGA cohort; B ICGC cohort). C The differences of the immune cell subtypes between the two risk groups in the TCGA cohort. D The differences of the immune-related pathways between the two risk groups in the TCGA cohort. E The differences of the immune cells subtypes between the two risk groups in the ICGC cohort. F The differences of the immune-related pathways between the two risk groups in the ICGC cohort. G, H Comparison of mRNAsi and mDNAsi of the high-risk and the low-risk groups in the TCGA cohort. (G mRNAsi; H mDNAsi). I, J The relationship of mRNAsi and m DNAsi with the risk score in the TCGA cohort. (I mRNAsi; J mDNAsi) (*P < 0.05, **P < 0.01, *** P < 0.001, ns P > 0.05)

