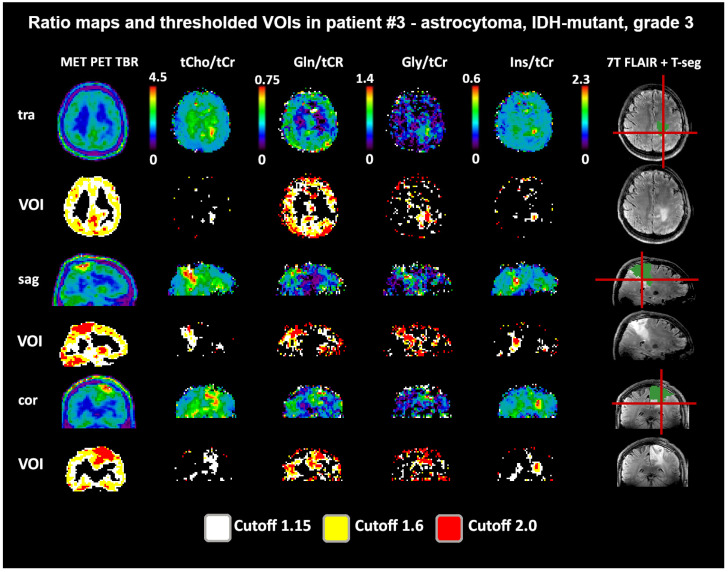
Figure 5.
Example images of a patient with a low-to-moderate intratumoral correspondence between PET and MRSI ratios to tCr. While Gln/tCr and Gly/tCr align most directly with MET (DSCs for TSEG1.6: 0.59 and 0.55), tCho/tCr extends clearly beyond (DSC for TSEG1.6: 0.25), and Ins/tCr is located only more basally (DSC for TSEG1.6: 0.13). The actual evaluation as performed only within the defined tumor segmentations is shown in green. PET maps were resampled to MRSI resolution.

