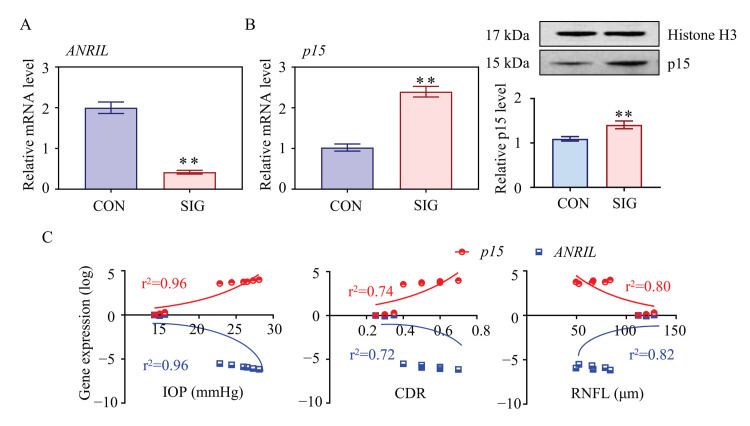
Figure 2.
Essential role of ANRIL/p15 in SIG progression. The expression level of ANRIL and p15 in TM samples was measured in control and SIG groups. (A) lncRNA ANRIL decreased in SIG TM samples as measured by real-time PCR. (B) Increases in p15 were shown in SIG samples by Western blot. (C) The correlation between the expression level of ANRIL/p15 and ocular manifestations (IOP, CDR, and RNFL) was presented (r2 values were calculated from Pearson’s method, all p < 0.05). Notes: n = 5 per group; CON = control; SIG = steroid-induced glaucoma; IOP = intraocular pressure; CDR = cup disc ratio; RNFL = retinal nerve fiber layer; ** p < 0.01 compared with control group.

