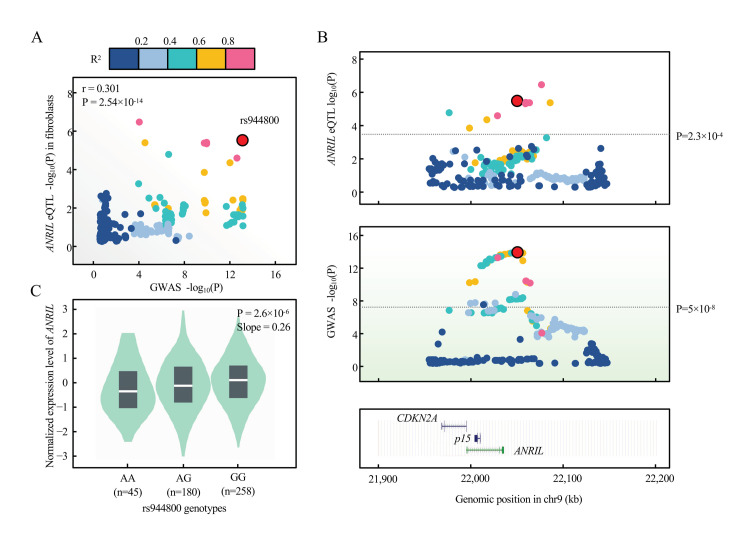
Figure 8.
Colocalization between glaucoma risk variant rs944800 and expression of ANRIL in GTEx. (A) eQTL signal in GTEx v8 fibroblast cells (n = 483) for ANRIL colocalizes with that of glaucoma GWAS on the lead variant, rs944800 by coloc (PPH4 = 0.688). Pearson correlation is shown between log-transformed p values of eQTL (y-axis) and GWAS (x-axis). Variants are color-coded based on the LD R2 (1000 Genomes, EUR, phase 3) with the candidate variant (red dot, rs944800). (B) Regional association plots of eQTL (blue shadow) and GWAS (green shadow) within +/− 100 kb of rs944800 are presented. The horizontal line indicates genome-wide significant p-value for GWAS (5 × 10⁻⁸) and genome-wide empirical p-value threshold for eQTL of ANRIL (2.3 × 10⁻⁴). UCSC tracks of gene and annotation are displayed as the full mode in this region. (C) eQTL violin plots were directly adopted from GTEx v8 data through GTEx portal (gtexportal.org). p-value and slope (relative to G allele in rs944800, which is the glaucoma protective allele) were derived from linear regression with no multiple-testing correction.

