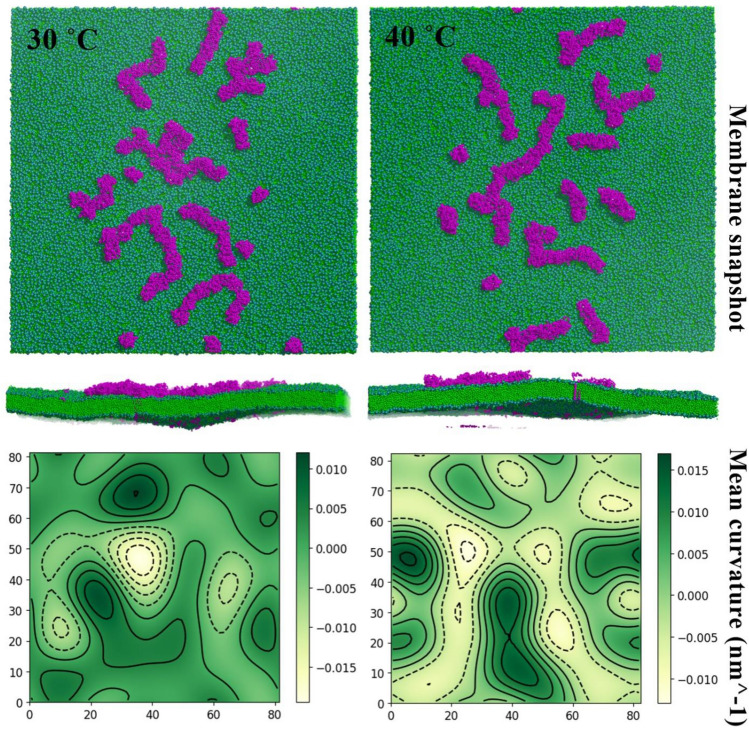
Fig. 10.
The effect of M protein aggregation on membrane curvature. The top panel shows the top and side views of representative membrane snapshots with 128 M protein monomers at 30 °C and 40 °C. The bottom panel shows the corresponding mean curvature of the membrane indicating prominent local curvatures

