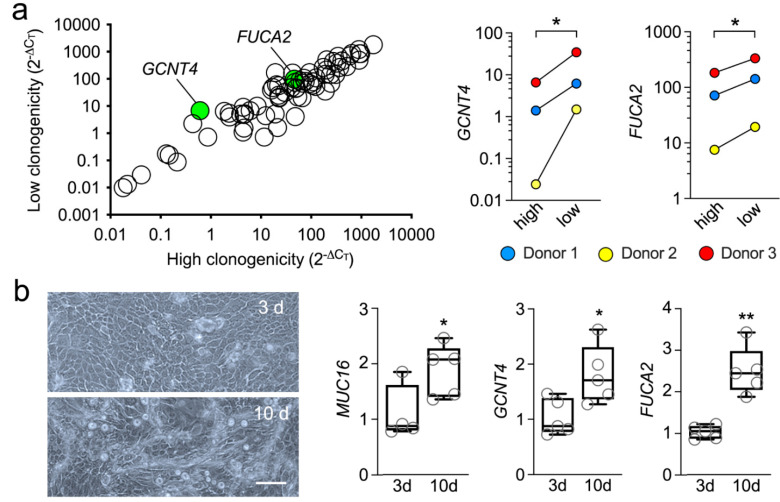
Figure 2.
Abortive clones contain high levels of GCNT4 and FUCA2. (a) Scatterplot comparing the expression of glycogenes in cells with different clonogenic potential (n = 3 independent donors). The green dots indicate statistically significant upregulation of the glycogene. The corresponding quantitative graphs are shown to the right. (b) Microscopic appearance of primary human limbal epithelial cells cultured at confluency for 3 or 10 days without supporting fibroblasts. By qPCR, MUC16, GCNT4 and FUCA2 mRNA were significantly upregulated after culture for 10 days (n = 4-5 independent experiments). The data in (a) are presented as individual paired values. The box-and-whisker plots in (b) show the 25 and 75 percentiles (boxes), the median, and the minimum and maximum data values (whiskers). Significance in (a) was determined using a multiple paired t-test and in (b) using the unpaired t-test or Mann–Whitney test for nonparametric data. Scale bar: 100 μm. *, p < 0.05; **, p < 0.01.

