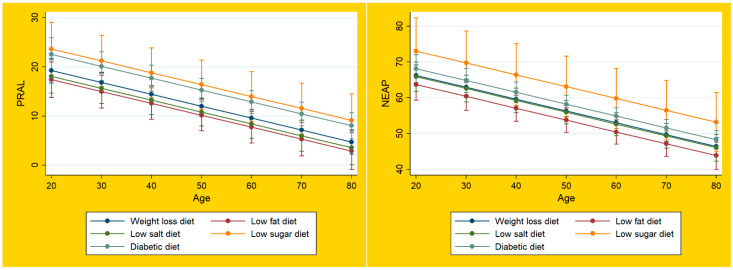
Figure 1.
Dietary acid load of special diets in the NHANES. Legend for Figure 1: Plots of marginal predicted values based on the regression model, illustrating differences in the linear relationship of PRALR and NEAPF and age, depending on each special diet.

