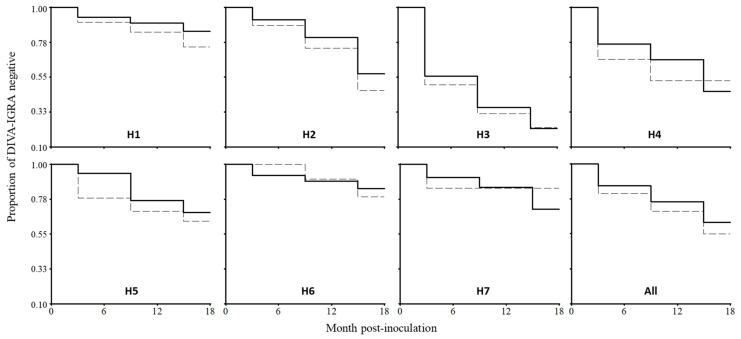
Figure 1.
Kaplan–Meier analysis on the comparison of IFN-γ release assay (IGRA) results using DIVA (CFP-10/ESAT-6 and Rv3615c) antigens between BCG-vaccinated (solid lines) and control groups (segmented lines). Tags indicate the herd ID (H1 to H7), and the last graph shows the results obtained with all the animals in the study (All).

