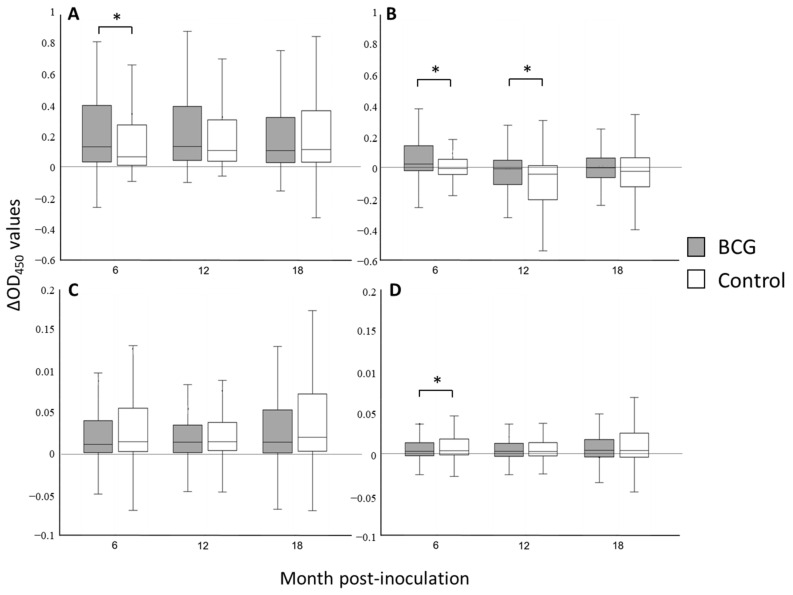
Figure 2.
Box-plot diagrams showing IFN-gamma responses at 6, 12 and 18 months post-inoculation in BCG and control groups. The figure shows the IFN-gamma release assay (IGRA) results (∆OD450) obtained with (A) PPDB minus saline, (B) PPD B-A (bovis minus avium), (C) CFP-10/ESAT-6 peptide cocktail minus saline and (D) RV3615c cocktail minus saline. Within box-plot diagrams, the median is represented with a line, the interquartile range with a box, and the minimum and maximum of the data with the whiskers. (* p < 0.05).

