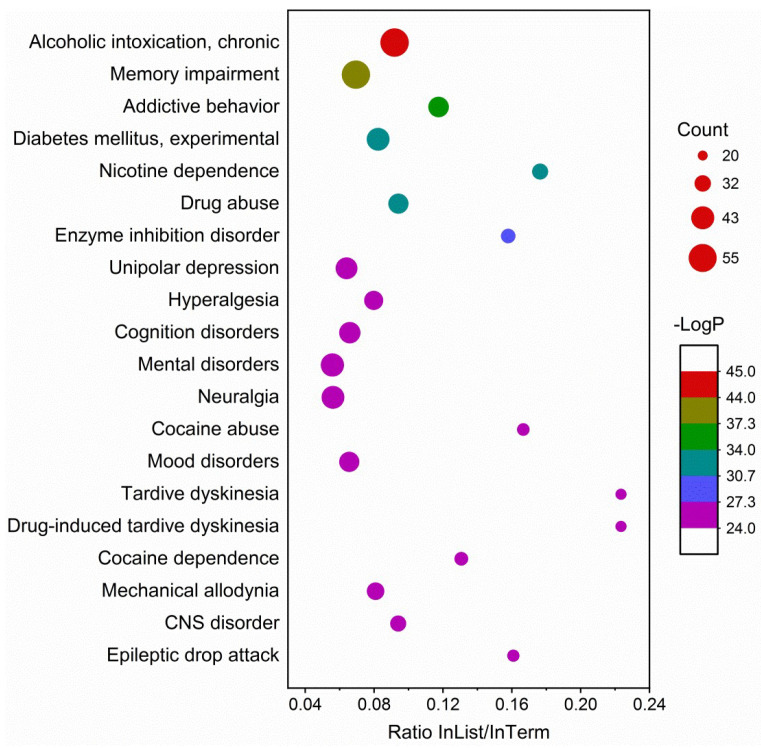
Figure 9.
Enrichment analysis on DisGeNET that demonstrates the representative top 20 enriched diseases. Count, the number of input genes that fall into this term; −Log P, the minus of p-value in log base 10; InList/InTerm ratio, the ratio of the gene count in the list that hit the term to the total gene count of this term.

