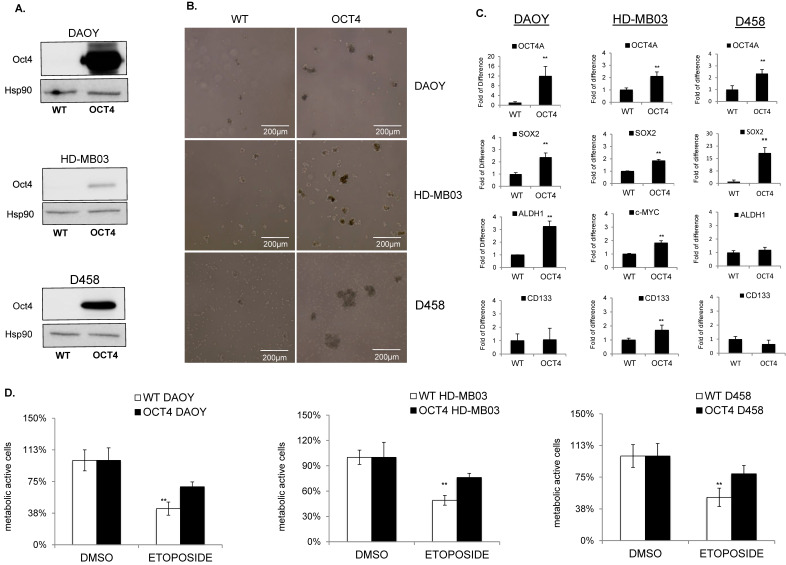
Figure 3.
OCT4A enhances TICs and resistance to chemotherapy. (A) Immunoblot analysis shows the expression level of OCT4 protein after overexpression in DAOY, HD-MB03, and D458 cells. Hsp90 was used as a loading control. (B) Representative images of tumorsphere(s) generated from wildtype (WT) (left panel) and OCT4-expressing (OCT4) cells (right panel) generated from DAOY, HD-MB03, and D458 cell lines as indicated. (C) qPCR analyses showing the expression level of OCT4A, CD133, SOX2, and ALDH1 in wildtype (WT) and OCT4-overexpressing (OCT4) cell lines as indicated. ** p < 0.01, according to two-tailed paired Student’s t-test. Data are the mean ± SD. (D) Cytotoxic effect analyzed in MTT assays of etoposide in parental (WT) and OCT4-overexpressing (OCT4) HD-MB03, DAOY, and D458 cells related to DMSO treated counterpart (DMSO). The original blots could be found in the Figure S9.

