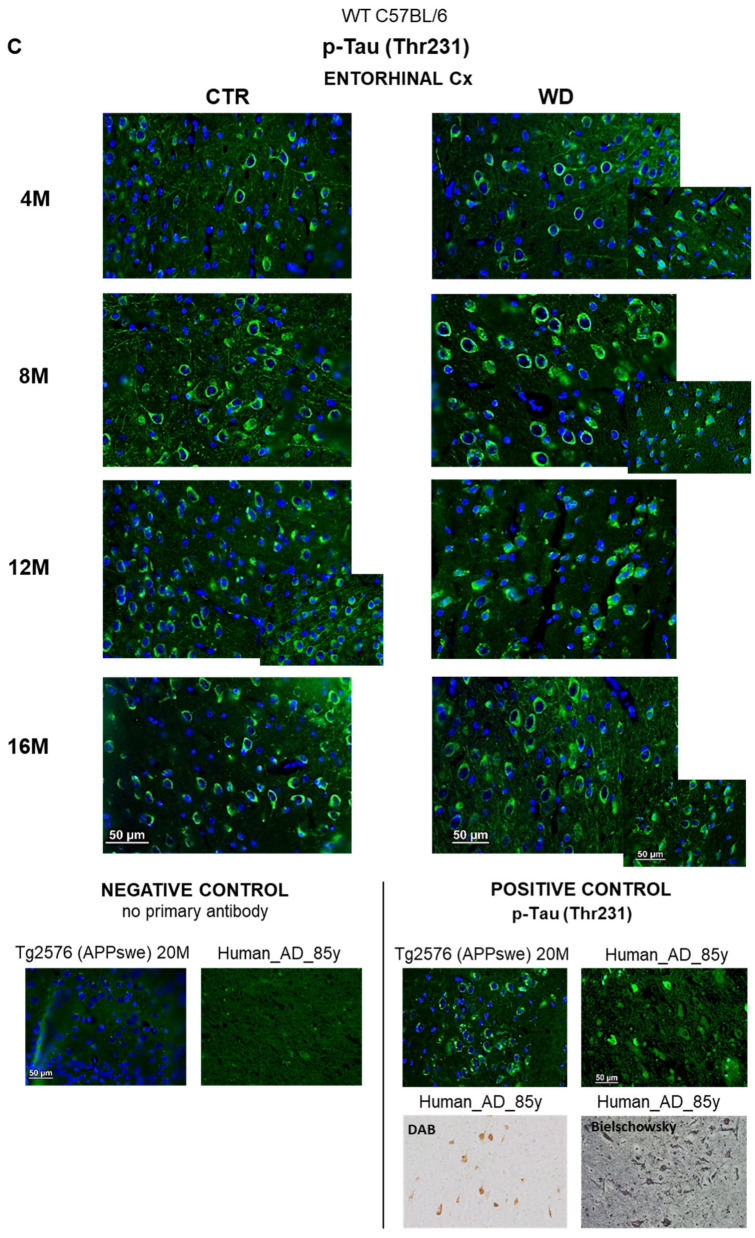
Figure 2.
The levels of brain insulin signaling markers and tau phosphorylated at threonine 231 residue in entorhinal cortex of WT C57BL/6J mice. (A) Quantification and statistical analysis. (B) Representative source Western blots. Statistical analysis comprised the Shapiro–Wilk normality test, two-way ANOVA, and Tukey’s post hoc test; significant results: p-IRS-1 (Ser616): (4M WD vs. 8M WD (p-Value = 0.0042); 4M WD vs. 12M WD (p-Value = 0.0016); 4M WD vs. 16M WD (p-Value = 0.0010); 12M CTR vs. 12M WD (p-Value = 0.0084); 16M CTR vs. 16M WD (p-Value = 0.0081)); p-GSK-3β (Ser9): (12M CTR vs. 12M WD (p-Value = 0.0491)). The source figures from the Western blot analysis are attached in Appendix A: Figure A1a,b; the completed statistical data are in the Supplementary Materials Tables S1 and S2). (C) Microphotographs showing representative preparations from the entorhinal cortex of C57BL/6 mouse brains from groups at 4-, 8-, 12-, and 16-months-old, immunofluorescently labeled with an antibody recognizing a tau protein isoform phosphorylated at the threonine 231 site. Negative and positive controls to staining specificity were performed in 20-month-old mice of the transgenic mouse model of AD—Tg2576 (APPswe) and a diagnosed human AD patient. 400× magnification.


