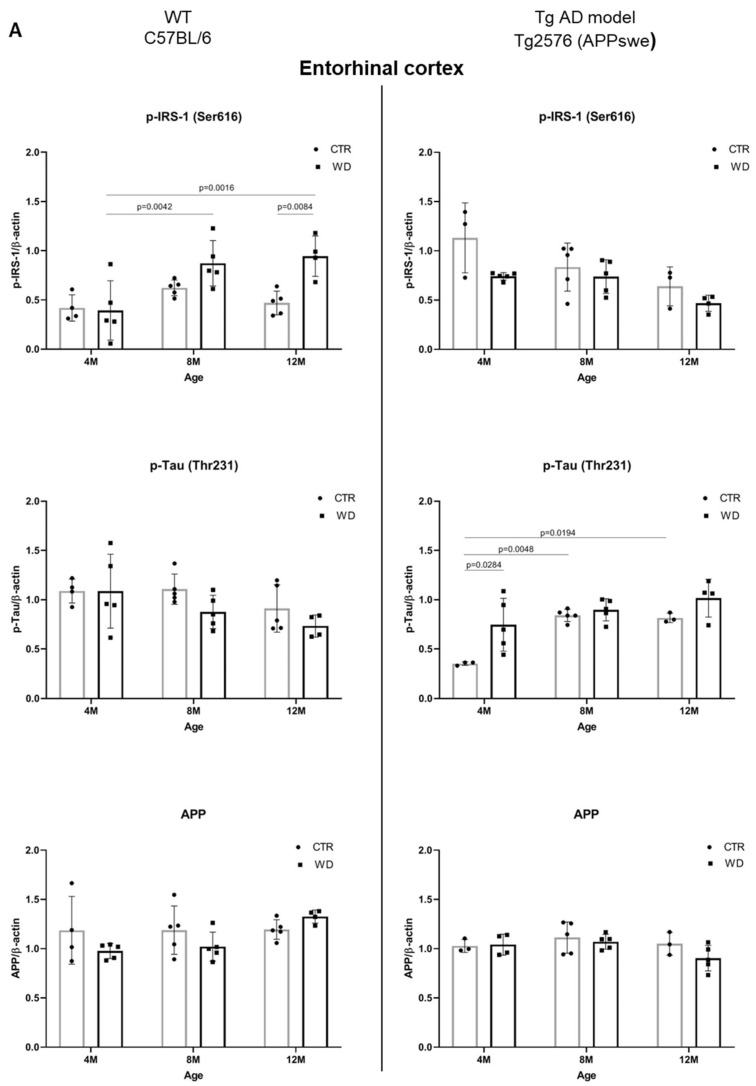
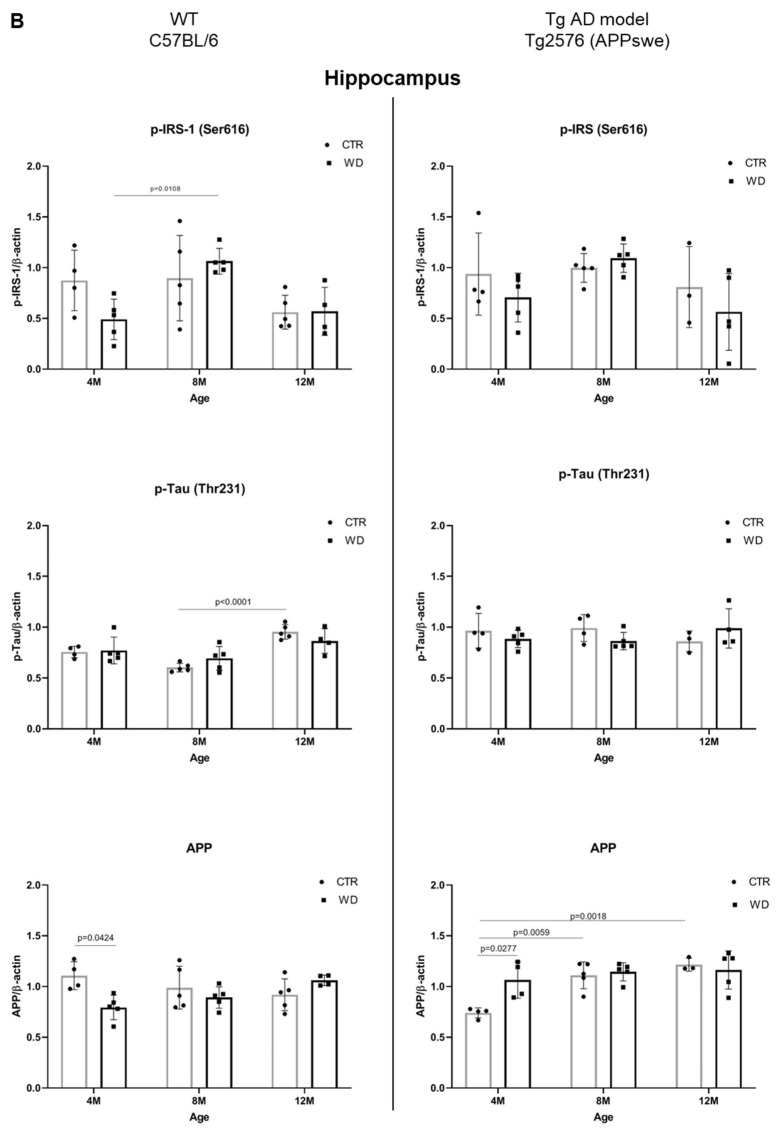
Figure 6.
(A). Quantitative analysis of the levels of insulin resistance and AD markers in entorhinal cortex—comparison of the AD model Tg2576 (APPswe) and wild-type C57BL/6J. Statistical analysis comprised the Shapiro–Wilk normality test, two-way ANOVA, and Tukey’s post hoc test; significant results: WT C57BL/6 p-IRS-1 (Ser616): (4M WD vs. 8M WD (p-Value = 0.0042); 4M WD vs. 12M WD (p-Value = 0.0016); 12M CTR vs. 12M WD (p-Value = 0.0084); Tg2576 (APPswe) p-Tau (Thr231): (4M CTR vs. 4M WD (p-Value = 0.0284)); 4M CTR vs. 8M CTR (p-Value = 0.0048); 4M CTR vs. 12M CTR (p-Value = 0.0194). Completed statistical data are in Supplementary Materials Table S4. (B) Quantitative analysis of the levels of insulin resistance and AD markers in the hippocampus—comparison of the Tg AD model Tg2576 (APPswe) and wild-type C57BL/6J. Shapiro–Wilk normality test, two-way ANOVA, and Tukey’s post hoc test; significant results: WT C57BL/6 p-IRS-1 (Ser616): (4M WD vs. 8M WD (p-Value = 0.0108)); p-Tau (Thr231): (8M CTR vs. 12M CTR (p-Value < 0.0001)); APP (4M CTR vs. 4M WD (p-Value = 0.424)); Tg2576 (APPswe) APP: (4M CTR vs. 4M WD (p-Value = 0.0277)); 4M CTR vs. 8M CTR (p-Value = 0.0059); 4M CTR vs. 12M CTR (p-Value = 0.0018). Completed statistical data are in Supplementary Materials Table S4.


