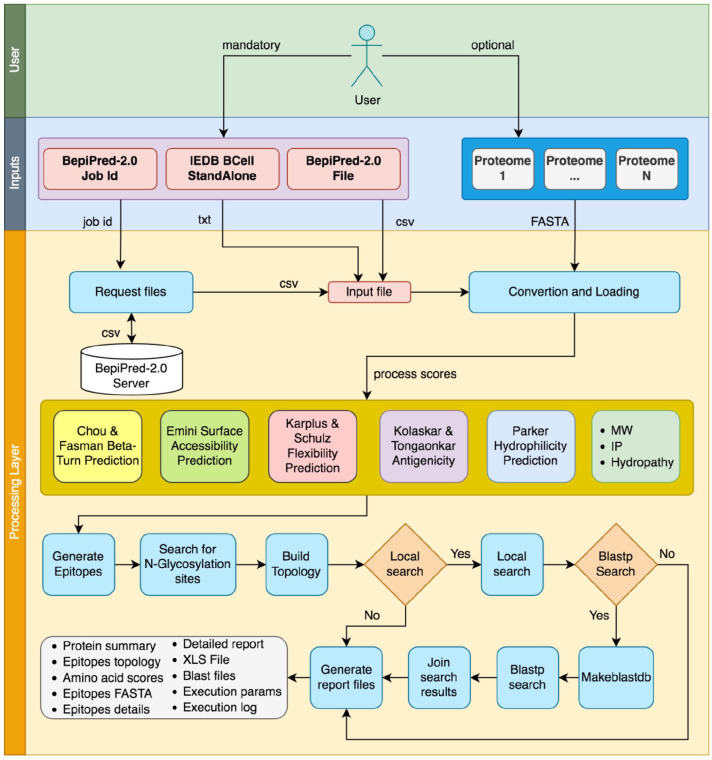
Figure 2.
The complete EpiBuilder pipeline, indicating input files (BepiPred-2.0 files and proteomes for query) and the internal process such as input loading and processing of software scores, searching for N-glycosylation, assembling of the topology, and the searching in proteomes. After all these steps, the reports are generated in several files. IEDB indicates Immune Epitope Database; MW, molecular mass; IP, Isoleletric Point.

