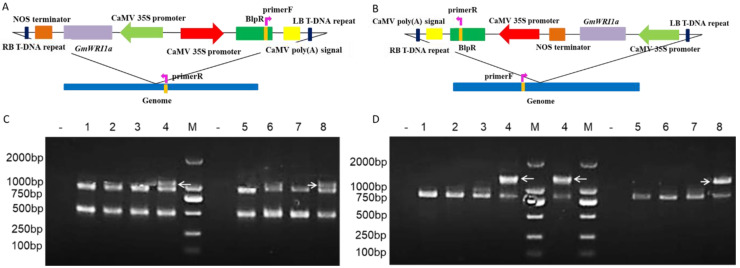
Figure 3.
Integration sites of the T-DNA in 3-1 and 31-1 soybean. (A) Location of primers designed for event-specific PCR detection of 3-1. (B) Location of primers designed for event-specific PCR detection of 31-1. (C) Confirmation of the integration sites of the 3-1, predicted on the basis of DNA sequencing and data analysis results; Lane—is water (negative control); Lane M is 2000 bp molecular weight marker ladder; Lanes 1–4 are PCR amplification of bar and flanking region from the genomic DNA of T3 generations 1-1, 31-1, 32-2, and 3-1 respectively; Lanes 5-8 are PCR amplification of bar and flanking region from the genomic DNA of T4 generations 1-1, 31-1, 32-2, and 3-1, respectively. (D) Confirmation of the integration sites of 31-1, predicted on the basis of DNA sequencing and data analysis results; Lane—is water (negative control); Lane M is 2000 bp molecular weight marker ladder; Lanes 1–4 are PCR amplification of bar and flanking region from the genomic DNA of T3 generations 1-1, 3-1, 32-2, and 31-1, respectively; Lanes 5–8 are PCR amplification of bar and flanking region from the genomic DNA of T4 generations 1-1, 3-1, 32-2, and 31-1, respectively.

