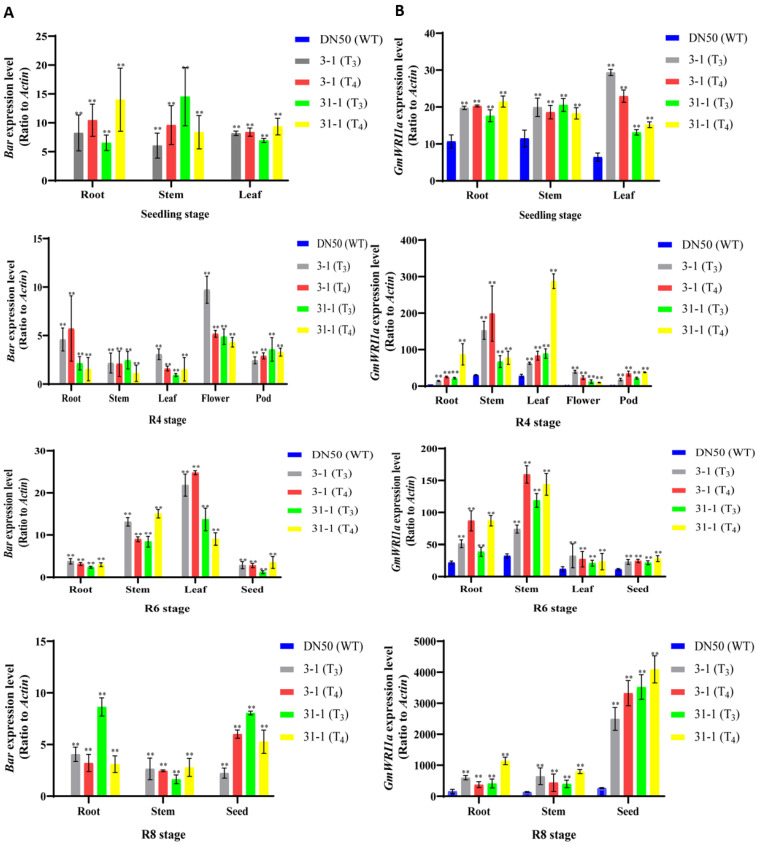
Figure 4.
Relative expression level of GmWRI1a and bar genes in the different organs during development stages. Transgene expression was normalized using GmActin4 gene and calibrated using the same sample under control conditions. Data shown represent the means ± SD of three independent experiments, with each experiment consisting of three technical replicates. Statistically significant differences between transgenic and WT plants are marked with asterisks (** p < 0.01; ANOVA). (A) The relative expression level of the bar gene in the different organs at four development stages from the T3 and T4 generation 3-1 and 31-1 soybean. (B) The relative expression level of the GmWRI1a gene in the different organs at four development stages from the T3 and T4 generation 3-1 and 31-1 soybean.

