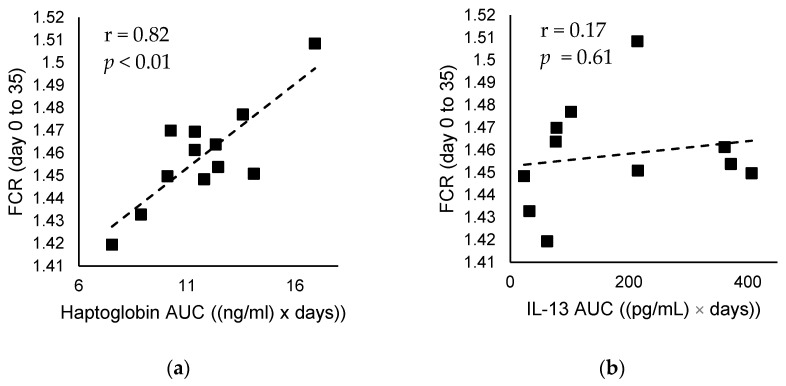
Figure 1.
Correlation between measures of immune response and feed conversion ratio (FCR) over the whole experimental period (day 0 to 35). (a) Haptoglobin AUC against feed conversion over the whole experimental period, (b) Interleukin-13 AUC against feed conversion over the whole experimental period. r, Pearson correlation coefficient; p, p-value.

