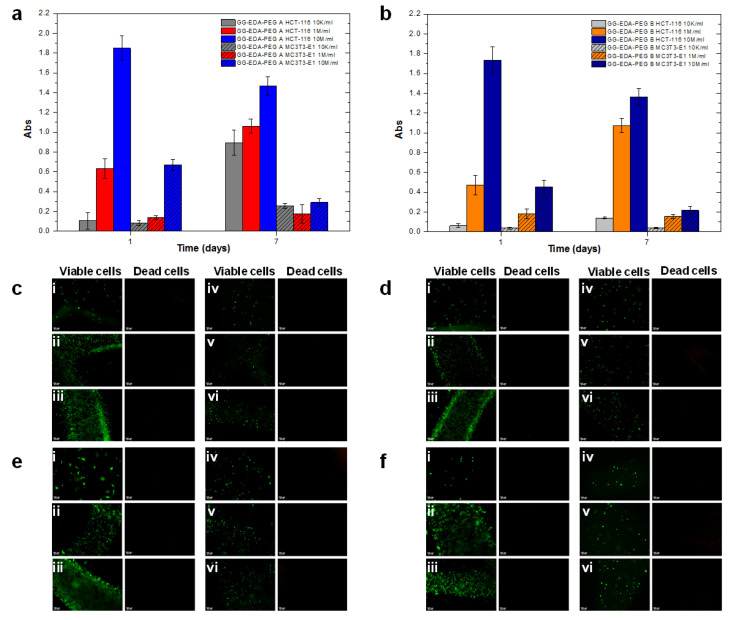
Figure 9.
Results of the MTS assay at two different times (1 and 7 days) for the encapsulated HCT-116 and MC3T3-E1 cells, at different densities, within bioinks (a) A and (b) B. The results are expressed as absorbance values at 490 nm. Results of the L&D assay at (c,d) 24 h and (e,f) 7 days for HCT-116 and MC3T3-E1 cells encapsulated, at different densities, within bioinks (c,e) A and (d,f) B. The different cell densities were (i) 10 K/mL, (ii) 1 M/mL, (iii) 10 M/mL for HCT-116 and (iv) 10 K/mL, (v) 1 M/mL, (vi) 10 M/mL for MC3T3-E1.

