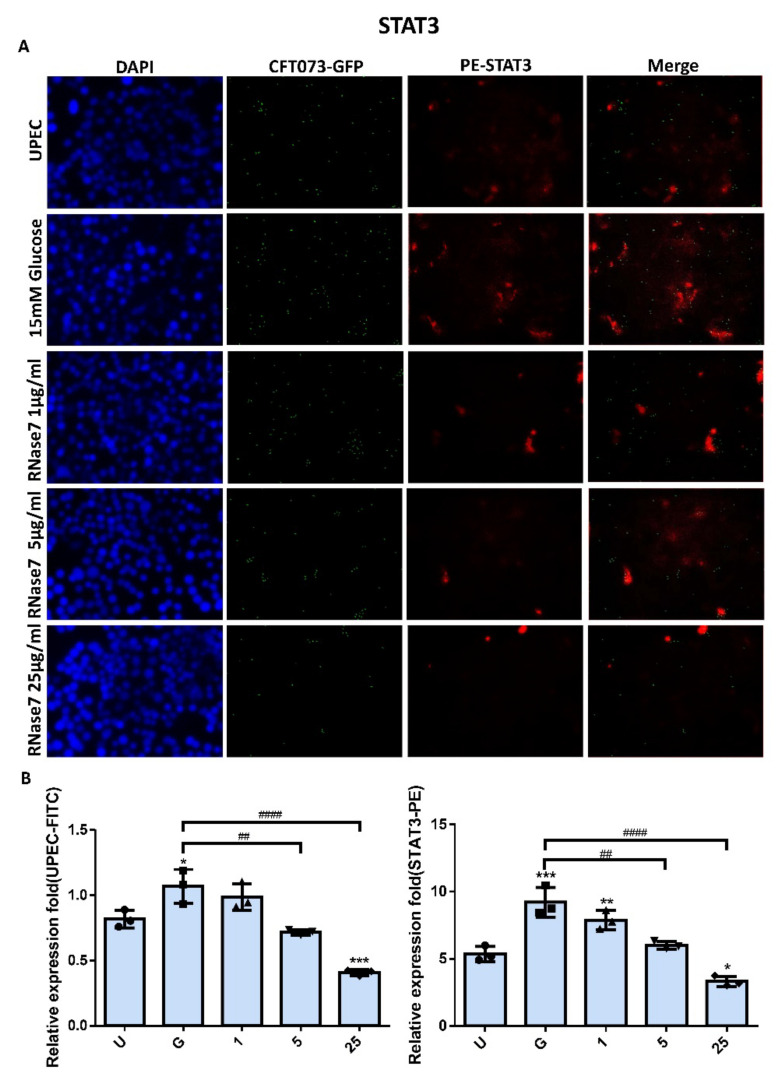
Figure 3.
RNase 7 affected UPEC infection and STAT3 expression in bladder cells. After 24 h of pretreatment with different concentrations of RNase 7 (1, 5, and 25 μg/mL) and 15 mM glucose, GFP-UPEC and PE-STAT3 expression in SV-HUC-1 cells post-infection were (A) observed by fluorescence microscopy and (B) measured using ImageJ software. Cells infected with UPEC alone were used as the positive controls. The data shown are representative of a typical result. DAPI was used to count the number of cells and as a standard for calculating the fluorescence expression ratio of cells. Cell images were captured using a microscope (Leica) at 100× magnification. The definitions of each letter/number represented by the X axis are: U: UPEC infection alone; G: with 15 mM glucose pretreatment alone; 1, 5, and 25: pretreated with 1, 5, and 25 μg/mL RNase 7, respectively, + 15 mM glucose. Data are expressed as the mean ± SD of three independent experiments. * p < 0.05, ** p < 0.01, *** p < 0.001, compared to UPEC infection control groups. ## p < 0.01, #### p < 0.0001, compared between the two groups.

