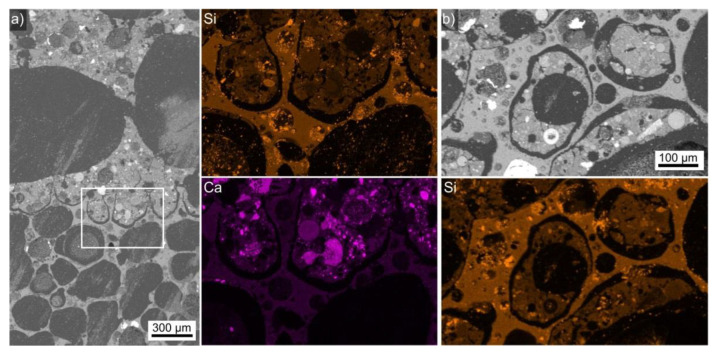
Figure 9.
(a) SEM micrograph featuring a cross section through the expanded glass-AAF composite presented in Figure 2d. The framed area was scanned by EDXS and element maps of Si and Ca are presented. (b) SEM micrograph of a segment where the AAF is completely surrounded by the expanded glass in the prepared cross section. The Si element map allows for the component attribution.

