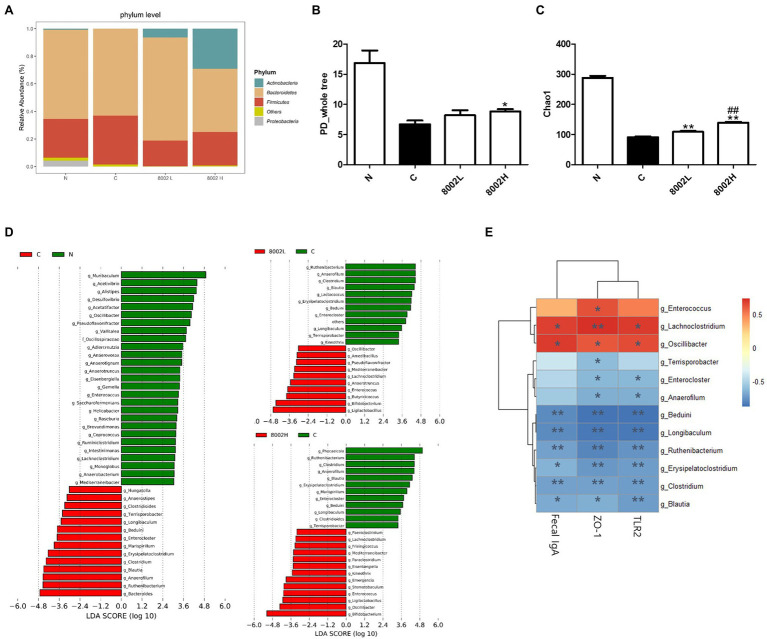
Figure 9.
Effect of HY8002 administration on the composition of bacterial taxa in mouse feces. (A) Relative abundance of phylum level in each treatment group. The α-diversity of each group: (B) PD_whole tree index and (C) Chao1 index. (D) Histogram of the linear discriminant analysis (LDA) scores for differentially abundant taxa following kanamycin treatment. (E) Correlation between bacterial genus-level taxa and measured intestinal integrity-related factors. Statistical analysis was conducted by the spearman correlation analysis. Data are represented as mean ± SEM. *p < 0.05 and **p < 0.01. ##p < 0.01 compared with 8002L groups. N, normal group (n = 4); C, kanamycin administration group (n = 4); 8002L, kanamycin with 1.0 × 10⁸ CFU/kg/day HY8002 administration group (n = 4); 8002H, kanamycin with 1.0 × 10⁹ CFU/kg/day HY8002 administration group (n = 4).

