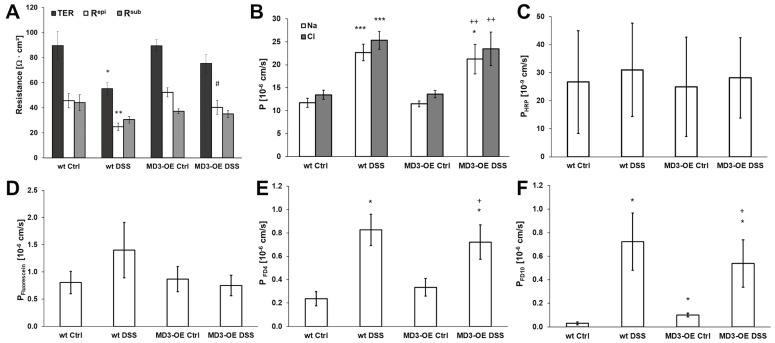
Figure 6.
Characterization of functional intestinal barrier properties in wt and MD3-OE mice during DSS-induced colitis. (A) Impedance spectroscopic differentiation of the TER in Repi and Rsub (n = 11–13). (B) Permeabilities for Na+ and Cl- as determined by dilution potentials (n = 5–13). (C) Permeability for the transcellular flux marker HRP (n = 5–8). (D) Permeability for the small paracellular flux marker fluorescein (n = 8–11). (E) Permeability for the macromolecular paracellular flux marker 4 kDa FITC-dextran FD4 (n = 5–10). (F) Permeability for the macromolecular paracellular flux marker 10 kDa FITC-dextran FD10 (n = 7–8). (* p < 0.05, ** p < 0.01, *** p < 0.001 compared to wt under Ctrl conditions; # p < 0.05 compared to wt DSS; + p < 0.05, ++ p < 0.01 compared to MD3-OE Ctrl).

