
Fig. 4. Widespread distribution of ASOs and tau knockdown in mouse brains.
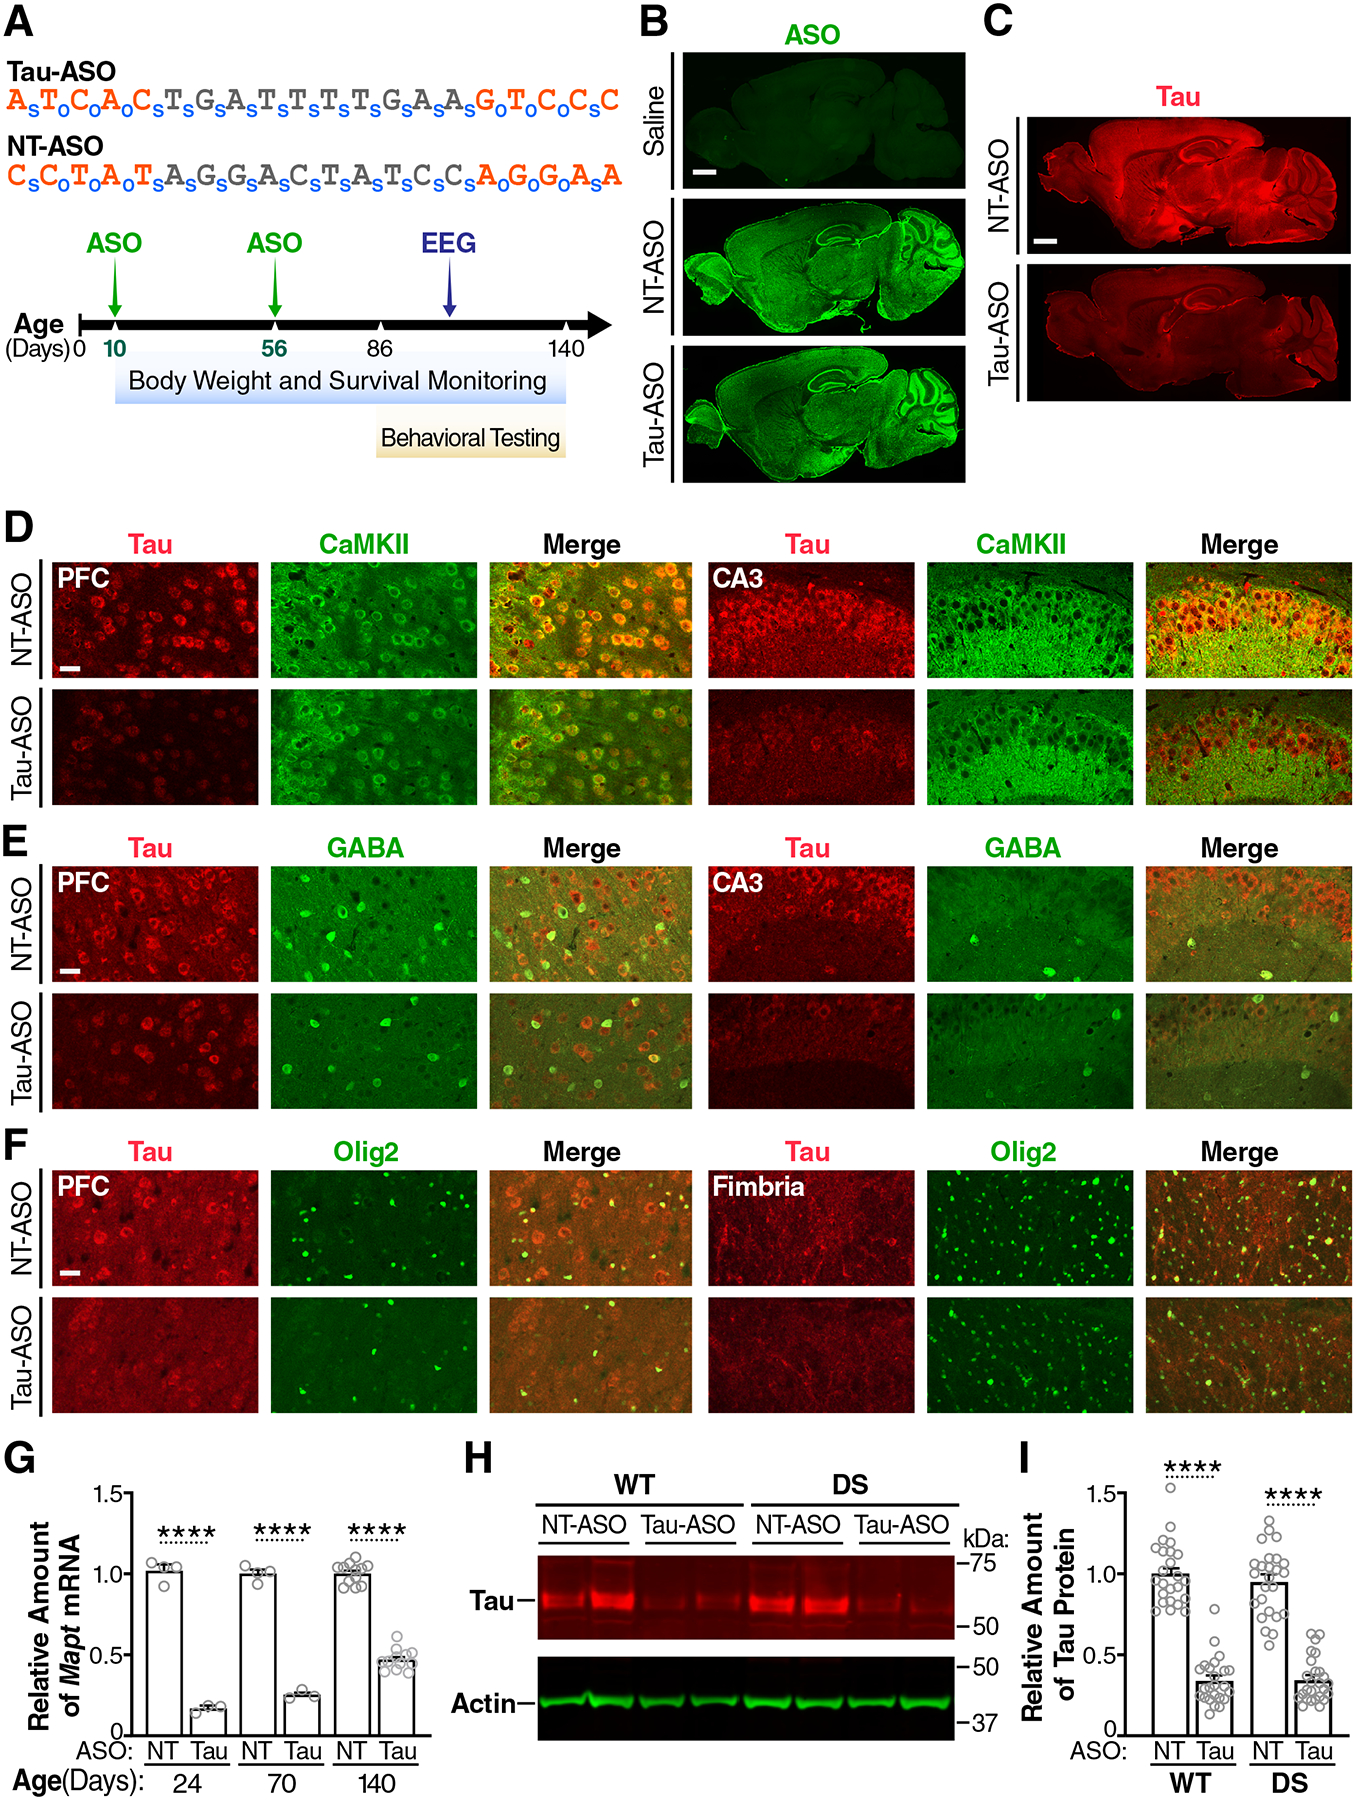
(A) Nucleotide sequences of the Tau-ASO and NT-ASO (top) and experimental design (bottom). Nucleotides containing 2′-O-methoxyethyl modifications are shown in orange. o, phosphodiester bond; s, phosphorothioate bond. WT and Scn1aRX/+ (DS) mice were injected ICV with the Tau-ASO or NT-ASO at P10 (200 μg) and P56 (300 μg). Replicate groups of mice were analyzed at P24, P70, or P140 for hippocampal tau expression and for other outcome measures as indicated. (B and C) Sagittal brain sections from 140-day-old WT mice showing representative distributions of ASO (B) and tau (C) immunostaining after the indicated ICV injections. Scale bars, 600 μm. (D to F) Sagittal brain sections from NT-ASO or Tau-ASO–treated 140-day-old WT mice coimmunolabeled for tau (red) and markers (green) of excitatory neurons (CaMKII) (D), inhibitory neurons (GABA) (E), or oligodendrocytes (Olig2) (F). PFC, prefrontal cortex; CA3, hippocampal subregion. Scale bars, 30 μm. (G) Hippocampal amounts of Mapt mRNA in replicate groups of WT mice treated as indicated and analyzed by RT-qPCR at P24 (n = 3–4 mice per group), P70 (n = 3–4 mice per group), or P140 (n = 12–13 mice per group). Mapt/Gapdh mRNA ratios in age-matched NT-ASO–treated mice were defined as 1.0. (H) Representative Western blot showing hippocampal amounts of tau and β-actin (loading control) in the indicated groups of mice at P140. Each lane contains a sample from a different mouse. (I) Hippocampal amounts of tau protein in the indicated mice (n = 24–26 per group) were quantified by Western blotting at P140. Mean tau/β-actin ratios in NT-ASO–treated WT mice were defined as 1.0. Gray circles represent data from individual mice. ****P < 0.0001 by two-way ANOVA and Holm-Sidak test. Values in (G) and (I) are means ± SEM.