
Fig. 6. Tau-ASO treatment reduces the overactivation of the PI3K-AKT-mTOR pathway and megalencephaly in DS mice.
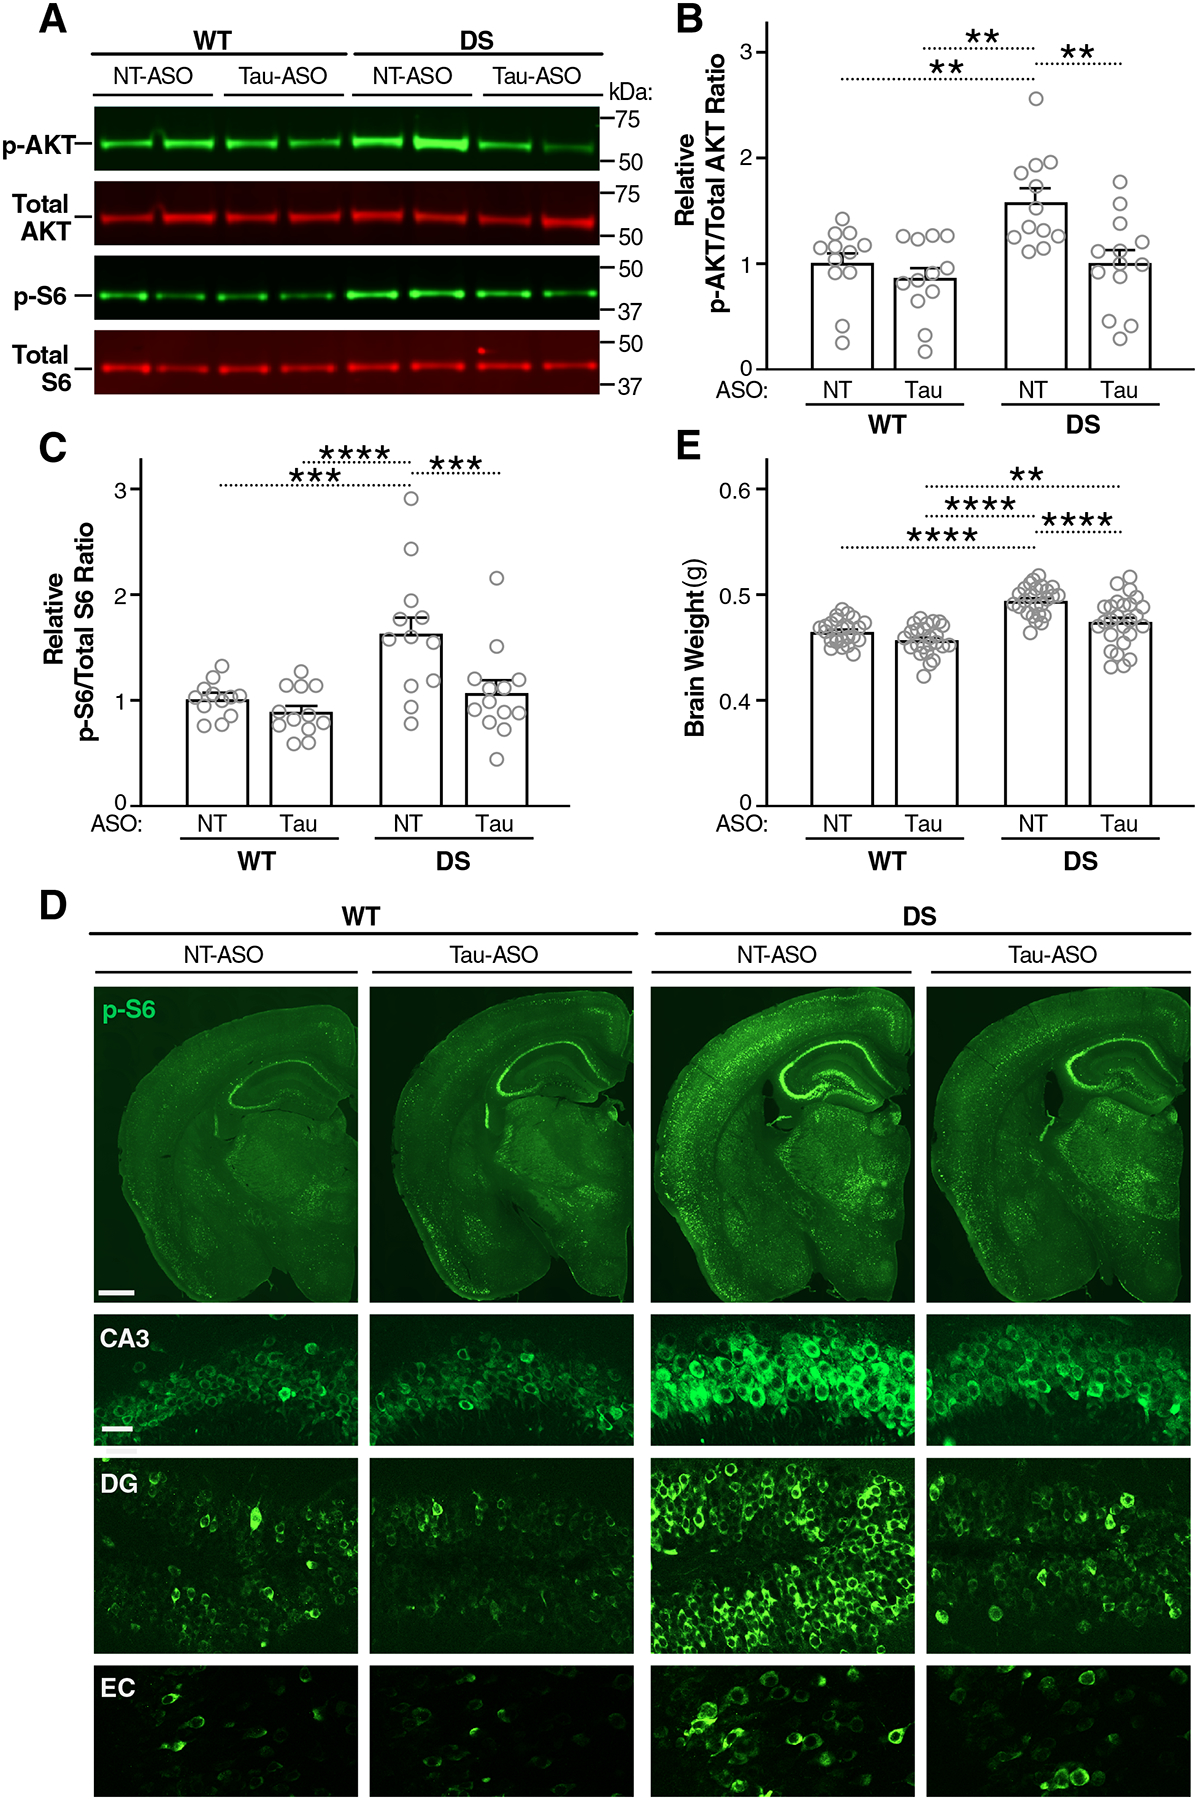
(A to E) After treatment with ASOs as in Fig. 4, WT and DS mice were assessed at P140 for hippocampal activation of the PI3K-AKT-mTOR pathway and brain weight. (A) Representative Western blot showing hippocampal amounts of p-AKT, total AKT, p-S6 (Ser 240/244), and total S6. MW markers are indicated on the right. (B and C) p-AKT/total AKT (B) and p-S6/total S6 (C) ratios in the hippocampus determined by Western blot analysis. Mean ratios in NT-ASO–treated WT mice were defined as 1.0. n = 12–13 animals. (D) Representative images of coronal brain sections immunostained for p-S6 (Ser 240/244). Hemibrains (scale bar, 600 μm) are shown in the top row and details (scale bar, 30 μm) of the hippocampal subfield CA3, the dentate gyrus (DG), and the entorhinal cortex (EC) are shown below. (E) Brain weights. n = 24–26 mice per group. **P < 0.01, ***P < 0.001, and ****P < 0.0001 by two-way ANOVA and Holm-Sidak test. Gray circles represent data from individual mice. Bars are means ± SEM.