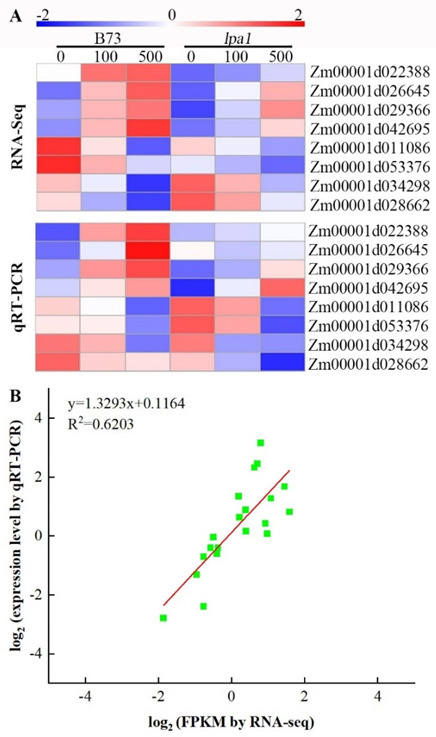
Figure 9.

The expression pattern of eight selected genes identified by RNA-seq was verified by qRT-PCR. (A) Heat map showing the expression changes (log2 fold change) in response to the B73-CK to lpa1-500 treatments for each candidate gene as measured by RNA-seq and qRT-PCR; (B) Scatter plot showing the changes in the expression (log-fold change) of selected genes based on RNA-seq via qRT-PCR. The gene expression levels are indicated by colored bars.
