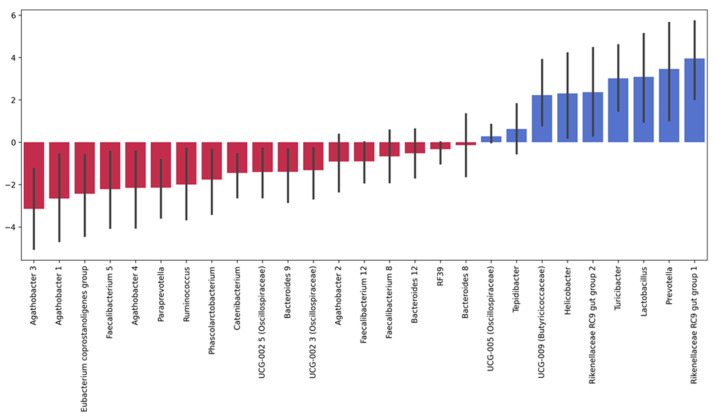
Figure 5.
Significant post-TBI changes in the relative abundance of intestinal microorganisms. Note: The height of each bar depicts a fold change in the abundance of a specific microorganism: blue bars show increase and red bars show decrease in post-TBI abundance. Error bars denote CI95% for each change. We calculated the fold change in each microorganism as the mean of its fold changes across all samples before and after the TBI.

