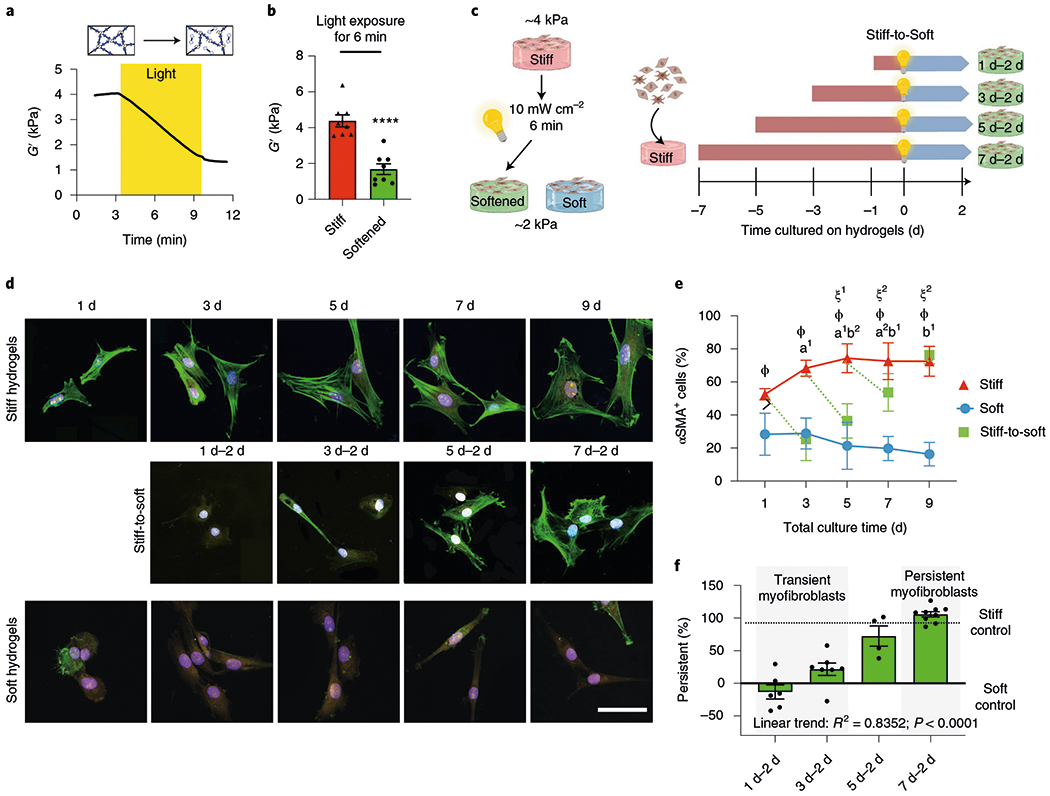
Fig. 1 |. Extended culture on stiff microenvironments induces persistence of myofibroblast activation.

a, PEG hydrogels soften with exposure to light due to a reduction in the crosslinking density (mean rheological traces, n = 5 traces). b, Hydrogels that match fibrotic- or healthy-tissue stiffness can be generated. Two-tailed paired Student’s t-test, ****P < 0.0001; n = 8. c, Schematic of the cell culture experiment to test for myofibroblast persistence. d, Representative images of primary aortic valve fibroblasts cultured on hydrogels for different time periods (n = 12 images per hydrogel). CellMask, yellow; αSMA, green; 4′,6-diamidino-2-phenylindole (DAPI), blue. Scale bar, 50 μm. e, Percentage of αSMA+ cells in the different groups following culture on hydrogels for different time periods. Significance of stiff-to-soft versus stiff: a1, P < 0.001 and a2, P = 0.003; significance of stiff-to-soft versus soft: b1, P < 0.001 and b2, P = 0.0379; significance of stiff versus soft: ϕ, P < 0.001; significance of stiff time point versus stiff day 1: ξ1, P = 0.004 and ξ2, P = 0.008; two-way analysis of variance (ANOVA) with Bonferroni’s multiple-comparison test; n = 5, 6, 8, 9 and 9 hydrogels for total culture time of 1, 3, 5, 7 and 9 d, respectively. f, Per cent myofibroblast persistence for cells cultured on hydrogels for different time periods. One-way ANOVA with test for the applied linear trend; R2, Pearson’s correlation coefficient; n =6 (1 d–2 d), 7 (3 d–2 d), 4 (5 d–2 d) and 9 (7 d–2 d) hydrogels. Data from five biologically independent replicates. Data reported as the mean ± s.e.m.
