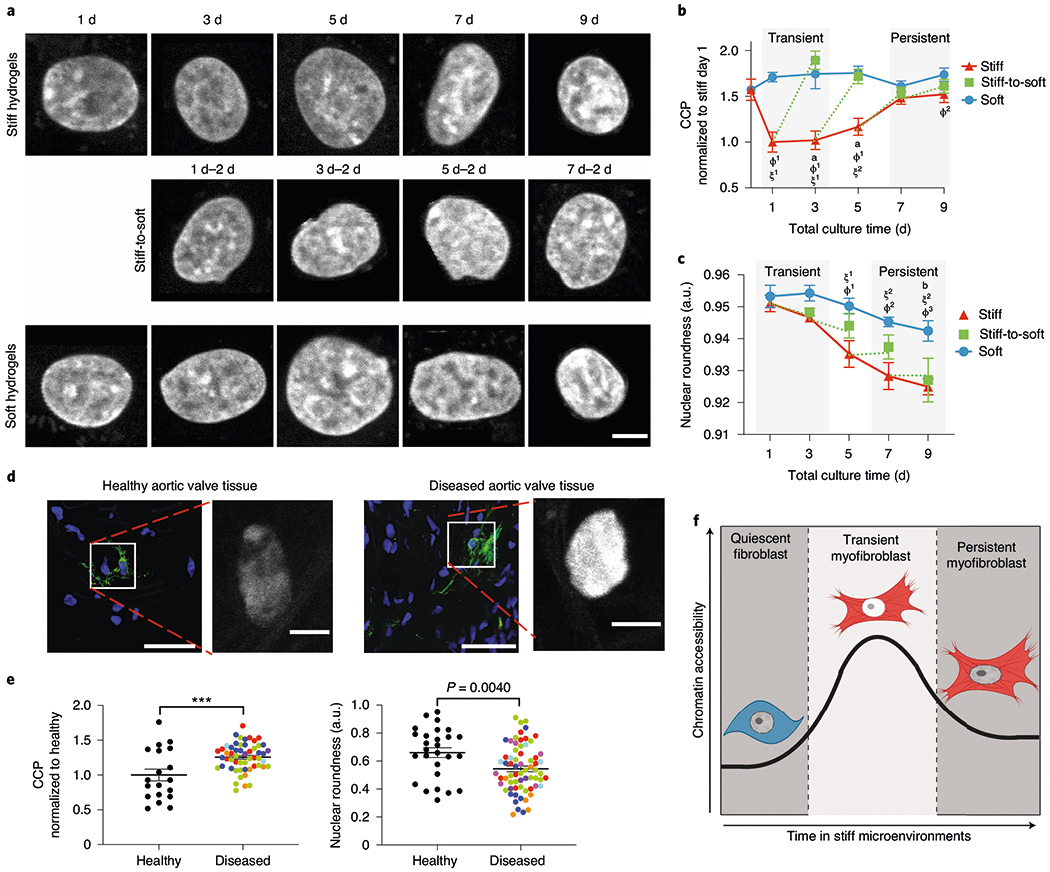
Fig. 2 |. Extended culture on stiff microenvironments reduces chromatin accessibility.

a, Representative images of DAPI-stained nuclei subjected to CCP analysis (n = 400 images). Scale bar, 5 μm. b, CCP for cells cultured on hydrogels for different time periods. Significance of stiff-to-soft versus stiff: a, P < 0.0001; significance of stiff versus soft: ϕ1, P < 0.001 and ϕ2, P = 0.0071; significance of stiff time point versus stiff day 0: ξ1, P < 0.001 and ξ2, P = 0.0013; two-way ANOVA with Bonferroni’s post-hoc test; 0 d, n = 16 cells; stiff, n = 72 (1 d), 89 (3 d), 102 (5 d), 169 (7 d) and 92 (9 d) cells; soft, n = 162 (1 d), 51 (3 d), 33 (5 d), 63 (7 d) and 47 (9 d) cells; stiff-to-soft, n = 53 (1 d–2 d), 61 (3 d–2 d), 67 (5 d–2 d) and 58 (7 d–2 d) cells. c, Nuclear roundness of cells cultured on hydrogels for different time periods. Significance of stiff-to-soft versus soft: b, P = 0.0074; significance of stiff time point versus stiff day 1: ξ1, P = 0.0046 and ξ2, P < 0.001; significance of stiff versus soft: ϕ1, P = 0.0093; ϕ2, P = 0.0027 and ϕ3, P = 0.0019; two-way ANOVA with Bonferroni’s post-hoc test. Soft, n =5 (1 d), 6 (3 d) and 8 (5, 7 and 9 d) hydrogels; stiff, n = 5 (1 d), 6 (3 d) and 8 (5, 7 and 9 d); stiff-to-soft, n = 5 (1 d–2 d, 3 d–2 d and 5 d–2 d) and 8 (7 d–2 d). d, Representative images of myofibroblasts and corresponding DAPI-stained nuclei from healthy (left) or diseased (right) human aortic valve tissue (n = 53 images from eight biological samples). Nuclei, blue; αSMA, green. Scale bars, 50 μm (main images) and 5 μm (insets). e, CCP (normalized to healthy tissue; left) and nuclear roundness (right) of DAPI-stained nuclei from healthy and diseased human aortic valve tissue. Colours indicate individual patients. Two-tailed Student’s t-test; CCP analysis, n = 19 (healthy) and 54 (diseased) cells; nuclear roundness, n = 27 (healthy) and 67 (diseased) cells. f, Illustration for the hypothesis that chromatin plays a role in myofibroblast persistence. ***P < 0.001. Data from three biologically independent replicates. Data reported as the mean ± s.e.m.; a.u., arbitrary units.
